Washington, D.C. – A new report from the National Council on Teacher Quality (NCTQ) reveals a troubling trend: Nationally, the diversity of the teacher workforce is growing at a slower pace than the diversity of college educated adults. That means people of color who could be teachers are increasingly opting out.
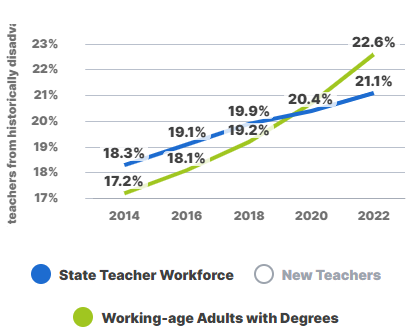
The report, A New Roadmap For Strengthening Teacher Diversity, analyzes data from NCTQ's new Teacher Diversity Dashboard showing that teacher diversity has been growing over recent years, albeit slowly. The percentage of teachers from historically disadvantaged racial backgrounds (American Indian, Black, Hispanic, Islander/Pacific Native, and two or more races) increased from 18.3% in 2014 to 21.1% in 2022*. Similarly, the percentage of college-educated adults from those same racial groups has also increased over that period. But the data also indicates a concerning change.
The teaching profession has long attracted more Black and brown adults than we would expect to see based on their representation in the broader group of all adults with college degrees. Until recently, the teacher workforce was slightly more diverse than the population of working-age adults. Now, as people of color are gaining a larger share of the degrees in the United States, their representation in the teacher workforce is not keeping pace.
This new data from NCTQ's Teacher Diversity Dashboard challenges the common narrative that we cannot increase teacher diversity because there aren't enough college educated adults from these racial demographics. In reality, Black and brown college graduates are increasingly represented among college-educated adults in America, suggesting that the true obstacles lie elsewhere.
In addition to college graduates, the broader population of working-age adults is another potential pool from which schools could increase teacher diversity. Across the country, one in three (35%) working age adults identifies as American Indian, Black, Hispanic, Islander/Pacific Native, or multi-racial, but only about one in five teachers is from one of these historically disadvantaged groups.
In collaboration with the Center for Black Educator Development (CBED), NCTQ presents a promising set of alternative strategies that promote representation of teachers of color, as well as increase overall teacher diversity within the workforce.
"Attempting to address the diversity gap between students and teachers is not enough," says Sharif El-Mekki, Founder and CEO of CBED. "Advocates and policymakers must consider how teacher diversity compares to the broader workforce if they want to truly understand and address the startling gaps in representation--gaps that have led, and continue to lead, to poor academic outcomes and larger racial economic disparities."
Why teacher diversity matters
Research shows that compared to white teachers, teachers of color produce additional positive academic, social-emotional, and behavioral outcomes for all students, regardless of race. And teachers of color have a pronounced influence on students of color:
Education leaders cannot fix what they cannot see. NCTQ's Teacher Diversity Dashboard brings together hard-to-access federal data to illuminate important trends in the racial demographics of the teacher workforce and broader population to inform teacher diversity efforts. The Dashboard serves as a rearview mirror—reflecting where states have been in matching their teacher workforce demographics to those of the broader adult population. It can also serve as a roadmap, showing states which teacher preparation programs are leading the way toward a more diverse teacher workforce and which are making the teacher workforce more white.
"Teachers of color have a positive impact on all students—especially students of color—yet our teacher workforce continues to lack racial diversity," says NCTQ President Dr. Heather Peske. "Addressing this issue begins with better data."
Use the NCTQ Teacher Diversity Dashboard to:
NCTQ's latest report, A New Roadmap For Strengthening Teacher Diversity sheds light on teacher diversity issues and offers promising strategies for creating a more diverse teacher workforce.
Explore the report: A New Roadmap For Strengthening Teacher Diversity
*The percentage of people from historically disadvantaged groups is calculated using a five year rolling average. For example, data showing roughly 18% of the teacher workforce is from these groups in 2014 means that the average level of diversity from 2009-2014 was 18%.
NEW DATA SHOWS TEACHER DIVERSITY IS SLOWING COMPARED TO THE DIVERSITY OF COLLEGE EDUCATED ADULTS
New tool gives education leaders data needed to increase teacher diversity
2024
Download Press Release###
About the National Council on Teacher Quality: NCTQ is a nonpartisan research and policy organization on a mission to ensure every child has access to an effective teacher and every teacher has the opportunity to be effective. We believe a strong, diverse teacher workforce is critical for providing all students with equitable educational opportunities. More information about NCTQ can be found on our website, www.nctq.org.