Cite this report
Putman, H. & Walsh, K. (2021). State of the States 2021: Teacher Preparation Policy. Washington, D.C.: National Council on Teacher Quality.

Putman, H. & Walsh, K. (2021). State of the States 2021: Teacher Preparation Policy. Washington, D.C.: National Council on Teacher Quality.
Children across the country face unprecedented levels of missed instruction as a result of the pandemic. As millions of students and teachers continue remote learning, experiment with hybrid models, and ultimately return to their classrooms, our nation has a greater need than ever for teachers who have the skills to address the challenges ahead.
Unfortunately, the COVID-19 pandemic has only further exacerbated the stark inequities of the American education system. The students whose education has been slowed the most by the pandemic have traditionally been and will likely continue to be assigned to classrooms led by the least effective and experienced teachers. With teacher quality as the most important in-school factor contributing to a child’s academic success, policymakers simply cannot afford to ignore the critical issue of teacher preparation.
It is incumbent upon teacher preparation programs, therefore, to deliver new teachers that can enter school districts and classrooms ready to provide an excellent education for their students. And, as the regulating authority over teacher preparation, states play an essential role in ensuring that their teacher prep programs are delivering new teachers who meet state standards.
This analysis considers state trends in many of the most essential aspects of delivering classroom-ready teachers, including the qualifications for being admitted into teacher preparation and earning a teaching license, with a focus on states’ shifting testing regimes. It also examines recent activity to diversify the teacher workforce as well as to improve the quality of clinical practice.
For additional information, including the state policy citations underpinning this analysis, visit the State Teacher Policy Database.
Note: In response to the pandemic, many states modified admissions, testing, and licensure requirements. Data for this report was collected prior to the pandemic and therefore does not reflect COVID-related policy changes. For more information on how states are addressing the impact of COVID on the teaching profession, see our COVID-19 resources.
Now more than ever, as children face so much disruption and missed learning, they need teachers who have the knowledge, skills, and experience to surmount these challenges. The students most affected by the pandemic are those who already face the greatest opportunity gaps, including the likelihood of being assigned to a novice teacher, not just once but many times over the course of their education.1
The quality of teacher preparation greatly determines how well a novice teacher will manage in that first year— pandemic or not. Good preparation makes a huge difference. For example, a novice teacher who trained under a first-rate mentor teacher learns so much that she is able to avoid many beginner mistakes, producing student gains normally not seen until teachers have three years of experience.2
State policies play a determinative role here as well. States’ regulation of teacher preparation programs establishes essential parameters, guiding teacher prep programs to provide the skills and knowledge public school teachers need. States also set the criteria that teachers must satisfy to earn a teaching license, but the particular criteria vary quite a bit from state to state.
This analysis considers states’ requirements for who is admitted into teacher preparation programs, as well as efforts to diversify the teacher candidate pool; licensure tests that measure teacher candidates’ academic skills, core content knowledge, and knowledge of essential teaching practices; and requirements for clinical practice. These data are based on policy information that was collected and confirmed in spring 2020.
This report is the second in a series from the National Council on Teacher Quality (NCTQ) examining the current status of states’ teacher policies. In this report we focus on state oversight of teacher preparation programs and licensure test requirements, particularly traditional preparation programs.3
In addition to the findings and trends presented here, users can access the raw data that makes our analysis possible, including all state policy citations. Data for this report can be retrieved from NCTQ’s State Teacher Policy Database, which covers the many areas of state policy affecting the lives of teachers. Users can also learn more about how we arrived at our conclusions and read responses from states about the conclusions we reached as well as our specific recommendations customized to each state.
NCTQ is grateful to state education agencies for their gracious cooperation in this work, both recently and over the past dozen years. These partnerships have been critical in helping to ensure the accuracy of this final product.
Many important attributes contribute to the effectiveness of a teacher, but academic aptitude stands out as particularly important and it has been studied extensively. Academic aptitude has been measured in a number of different ways, including the SAT, ACT, GRE, and the Praxis Core Academic Skills for Educators. Grades, too, are often used as a measure of not just an aspiring teacher’s academic aptitude but their persistence.
Decades of research and lessons learned from high-performing countries support the importance of determining whether teacher candidates possess a sufficient level of academic aptitude to teach.4 What is less clear is the line separating sufficient from insufficient, a problem resulting from too little research into the specific measures used to assess academic aptitude, both licensure tests and proxy measures states might consider.
The latest research on this front is particularly relevant. A team of researchers looked at the Massachusetts licensure tests and found that first-attempt scores on licensure tests (including the Communication and Literacy Skills test that serves as a basic skills test) predicted teachers’ effectiveness in the classroom.5
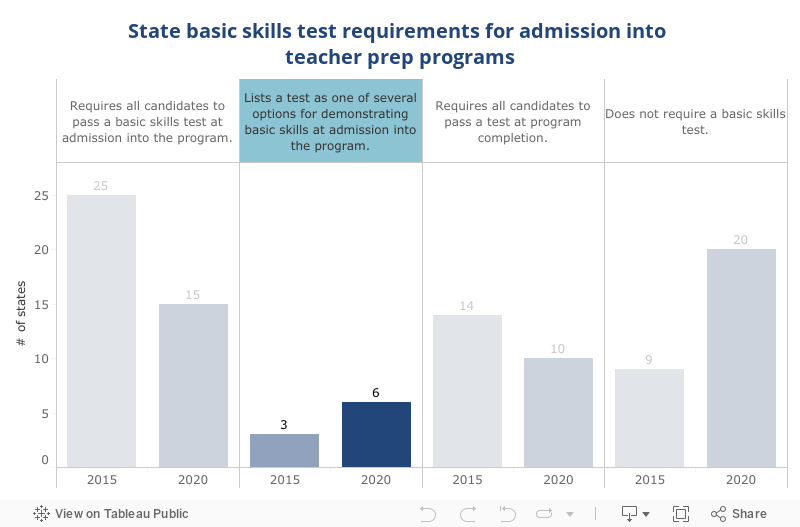
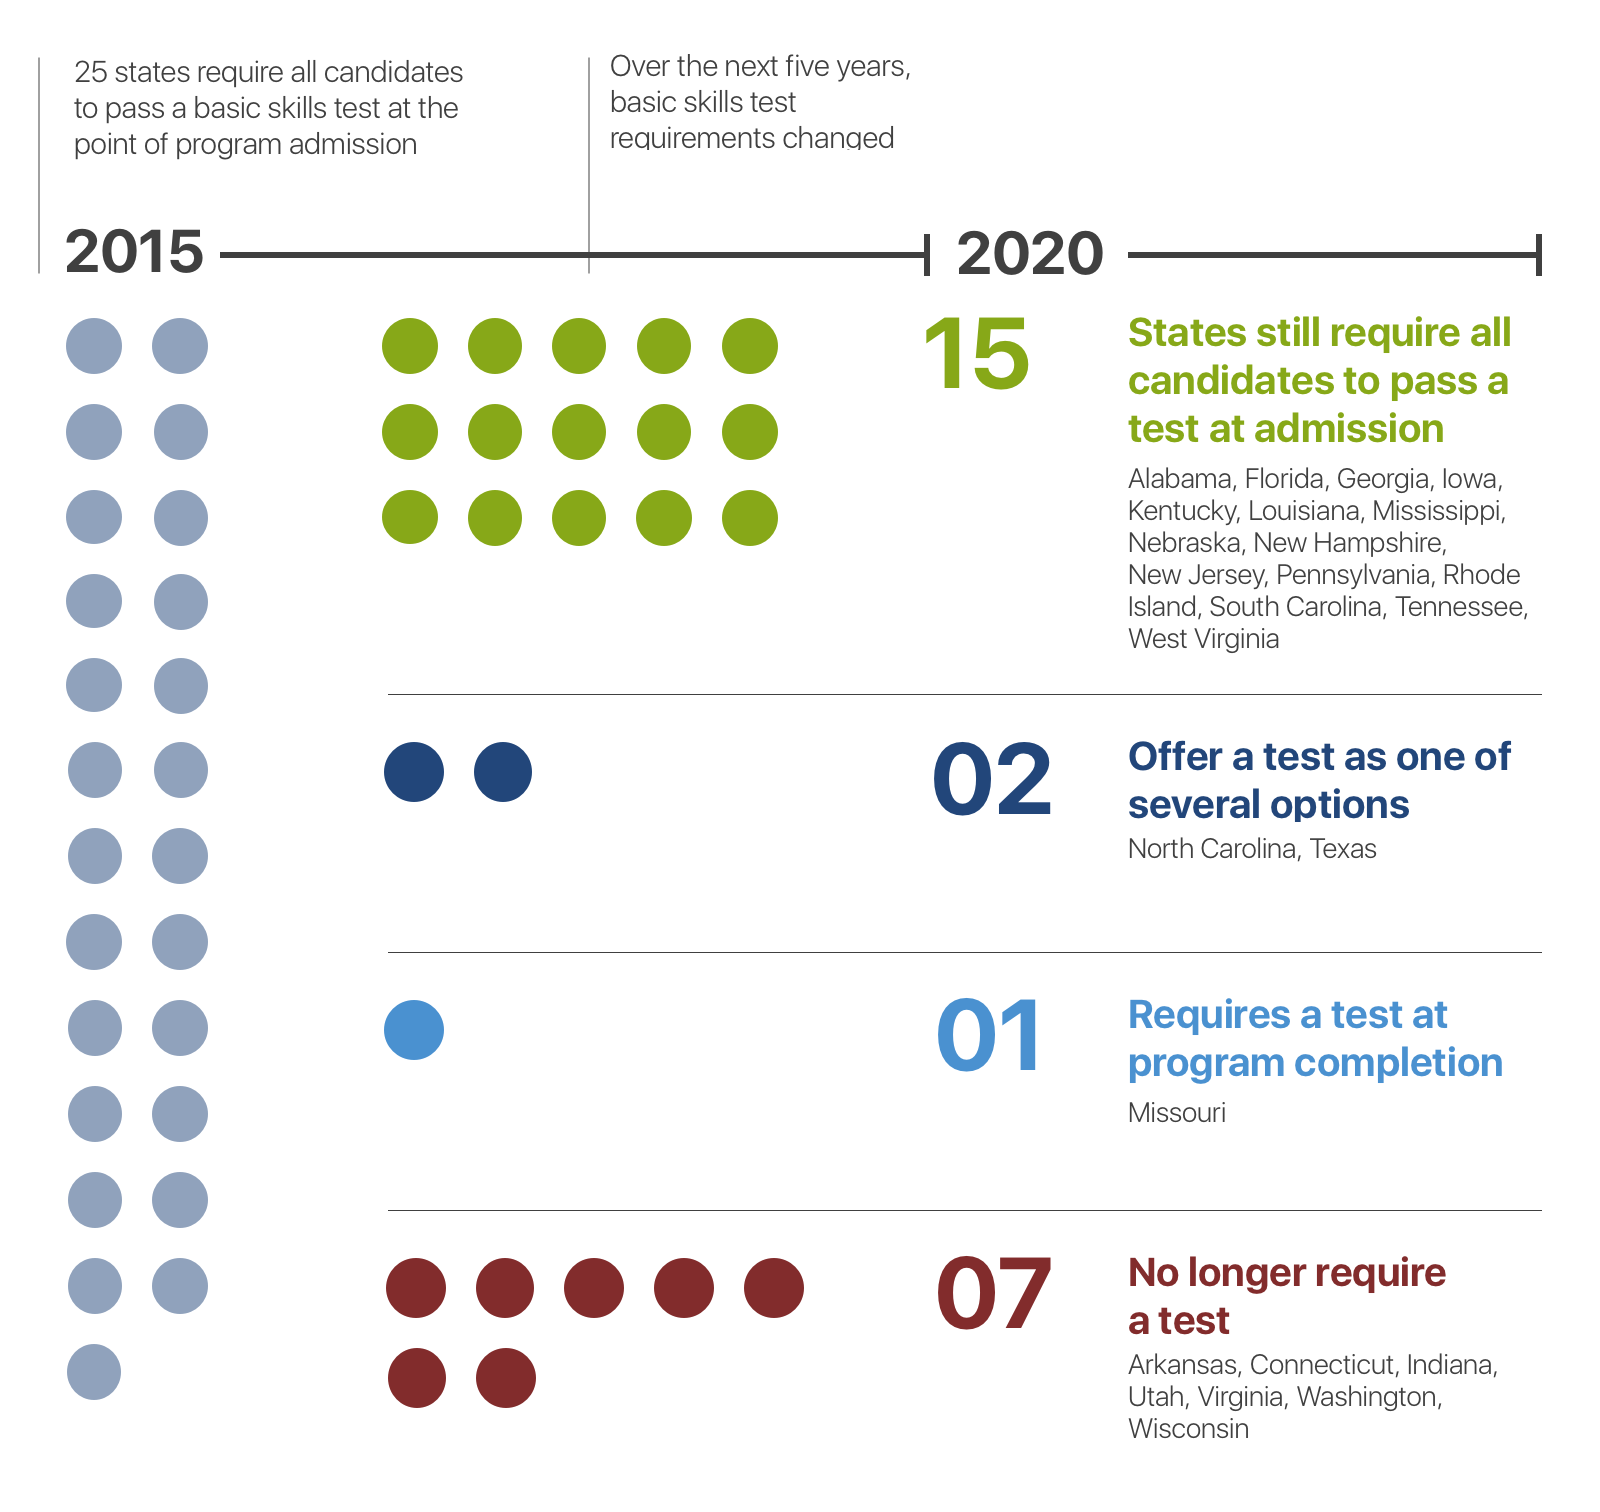
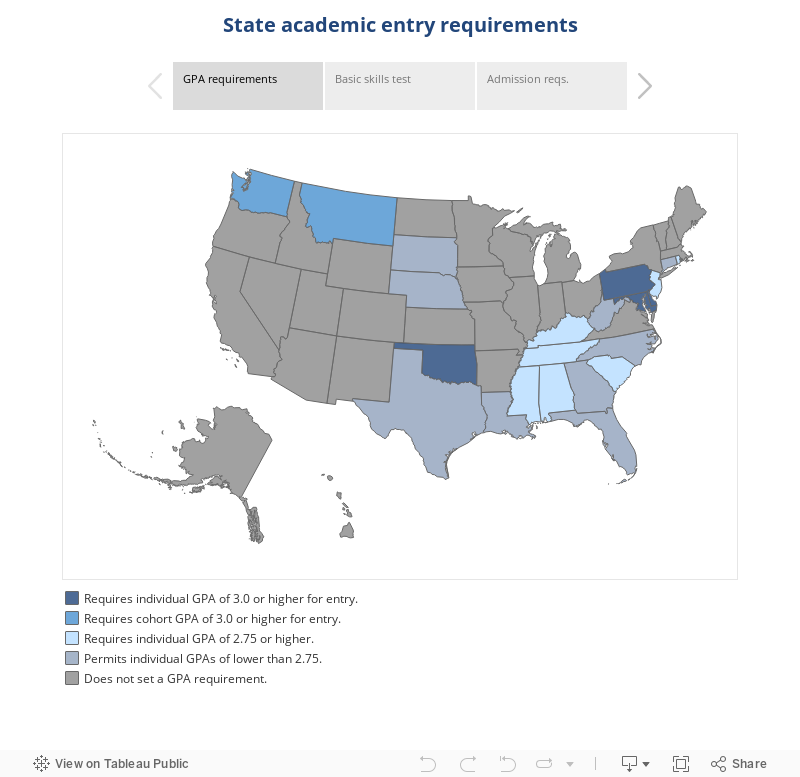
In terms of entry test requirements, 15 states still require candidates to pass a basic skills test that generally measures the reading, writing, and mathematics skills of an aspiring teacher candidate (or comparable scores on the SAT or ACT) in order to earn admission into a teacher preparation program. This is a decline from 25 states in 2015.6
Of the 10 states that no longer require all candidates to pass the test for admission,7 seven have dropped the test entirely (Arkansas, Connecticut, Indiana, Utah, Virginia, Washington, Wisconsin), one (Missouri) has shifted the requirement to program completion, and two (North Carolina, Texas) now make the test optional by allowing other measures to serve as proxies (see box). Of the remaining 15 states still requiring a test for admission, three (Florida, Rhode Island, West Virginia) now allow programs to admit candidates based on a cohort average (rather than require each individual to pass the test), or to otherwise waive requirements for a small portion of candidates.
Six states offer candidates alternative ways to demonstrate academic skills other than passing a test, although it is not always clear whether states reviewed evidence on the validity of these proxy measures:
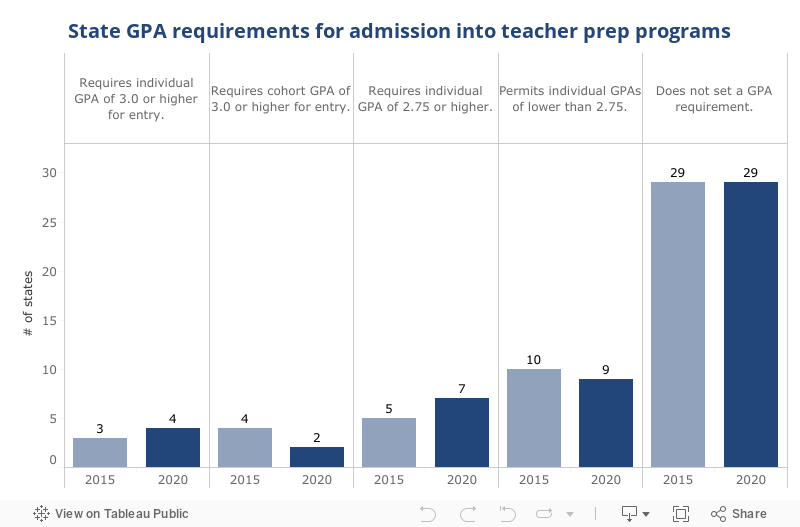
Despite the shift from test requirements, few states have moved toward considering candidates’ academic records (using students’ college grade point average, or GPA). Four states (Delaware, Maryland, Oklahoma, Pennsylvania) now require candidates to have individual GPAs of 3.0 or higher (a B average), up from three states in 2015 (Oklahoma, Pennsylvania, Utah). With the exception of Pennsylvania, these states all allow candidates to demonstrate academic aptitude through either passing a basic skills test or having a 3.0 GPA.8
There has been a slight movement at the lower end of the distribution, with 38 states now either setting no GPA standard at all to enter a teacher preparation program or setting the minimum GPA at 2.75 or lower—well below the national mean GPA of 3.0.9 That number was 39 states in 2015.
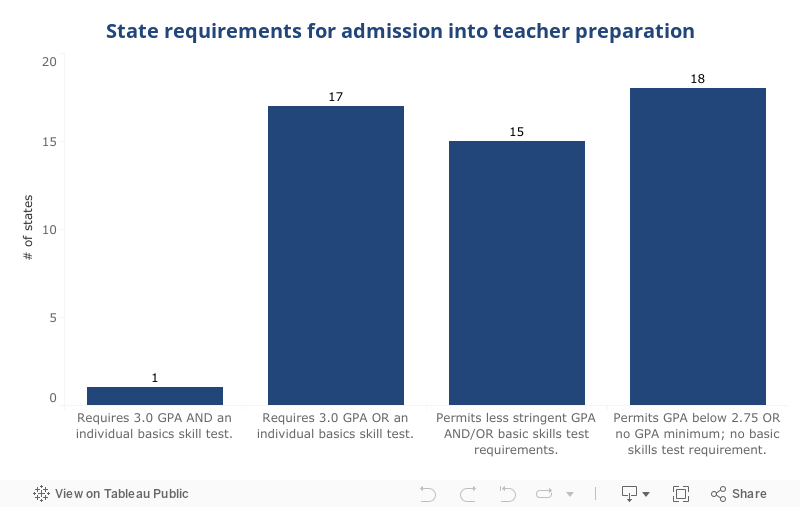
Considering these two measures of academic aptitude at entry into a teacher preparation program (basic skills testing and GPA), only about a third of all states approach a standard that will result in programs restricting admissions to more academically capable students. Only one state (Pennsylvania) requires both a B average individual GPA and passing a basic skills test, and 17 states have one of the two measures in place, but not both. Fifteen states set less stringent requirements (e.g., allowing cohort GPA averages or not requiring passing a basic skills test until completion of the preparation program). The remaining 18 states do not require a basic skills test and set either a very low or no GPA requirement.
States often set different requirements for alternative route programs. Of the 47 states that allow alternate route programs, only seven require all candidates to have a strong academic standing.
For more information about each state’s alternative route preparation program entry requirements, visit NCTQ’s State Teacher Policy Database.
The importance of building a diverse teacher workforce is unequivocal. Teachers of color have been linked to greater academic gains for same-race students, and especially for Black students.10 These gains include short-term benefits like higher test scores, and longer-term benefits like higher rates of college matriculation.11 Teachers of color view the behavior and academic prospects of students of color more positively, and they have higher expectations that those students will graduate from college.12 Further, Black students are more likely to enroll in gifted services and in advanced courses when taught by a Black teacher.13
However, the current teacher workforce does not reflect the diversity of the student body, a problem that can be attributed only in part to the fact that the adult population in the U.S. is considerably whiter than the population under 18.14 Teaching has historically not attracted Black and Hispanic individuals at the rate of white individuals.15 Just over half of K-12 public school students are students of color, compared with 21% of teachers who identify as people of color.16
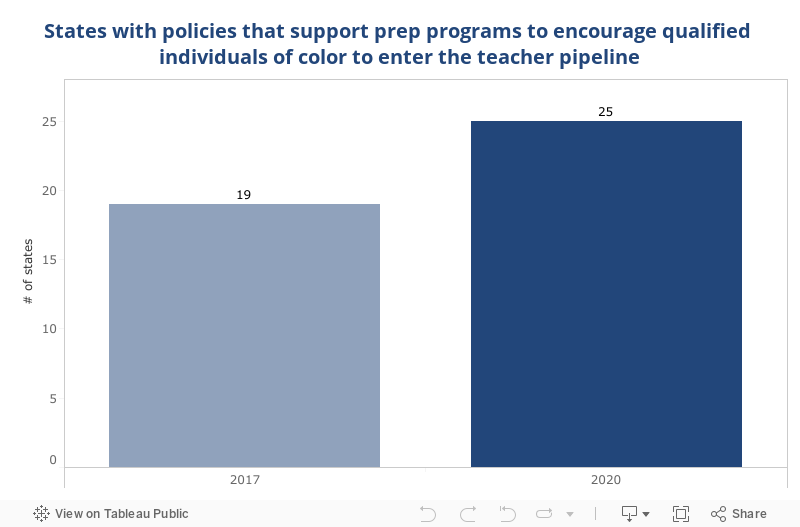
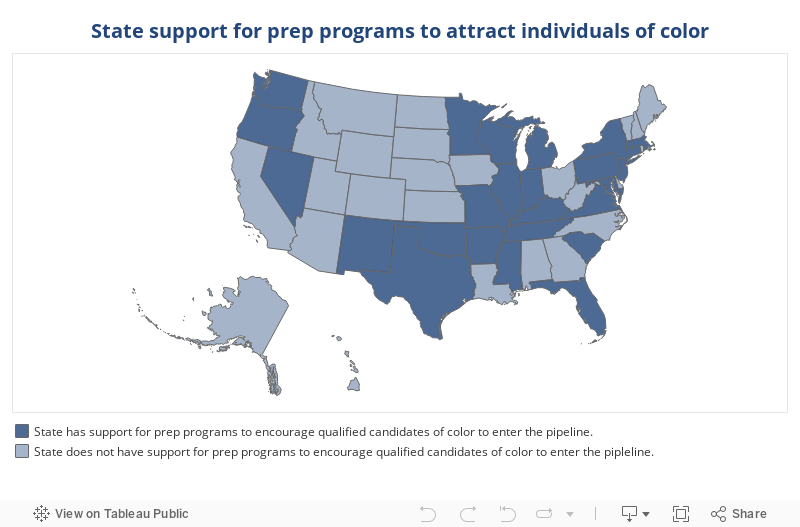
States can take a number of steps to encourage more teacher candidates of color to enter the pipeline, as outlined below. Currently, only half of states have policies with this explicit goal.
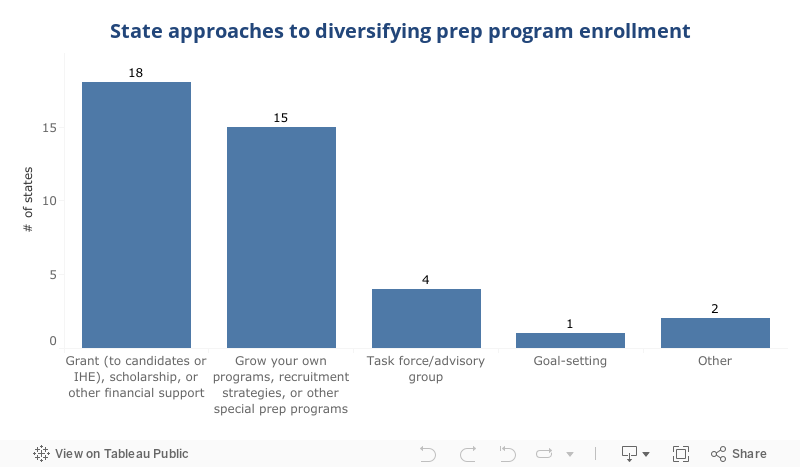
Approaches to bring more diverse candidates into teacher preparation programs include the following:
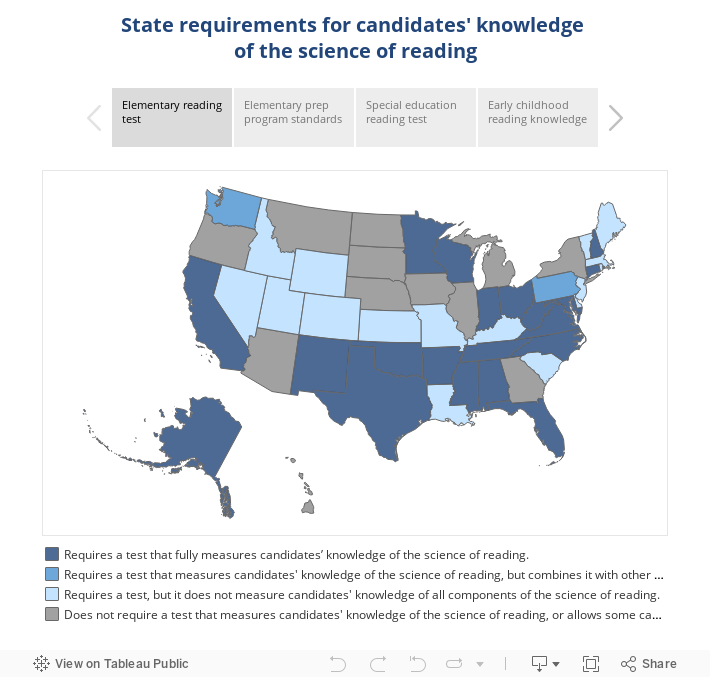
A third of the nation’s students reach fourth grade unable to read at even a basic level.17 This problem is especially stark for students of color: Only about half of Black and Hispanic fourth grade students can read at a basic level.18 As school expectations shift from students learning to read to reading to learn, these students will fall further and further behind. However, providing students with instruction that follows the science of reading, established by a landmark analysis of decades of research, can slash the rate of reading failure from three in 10 children to one in 10.19
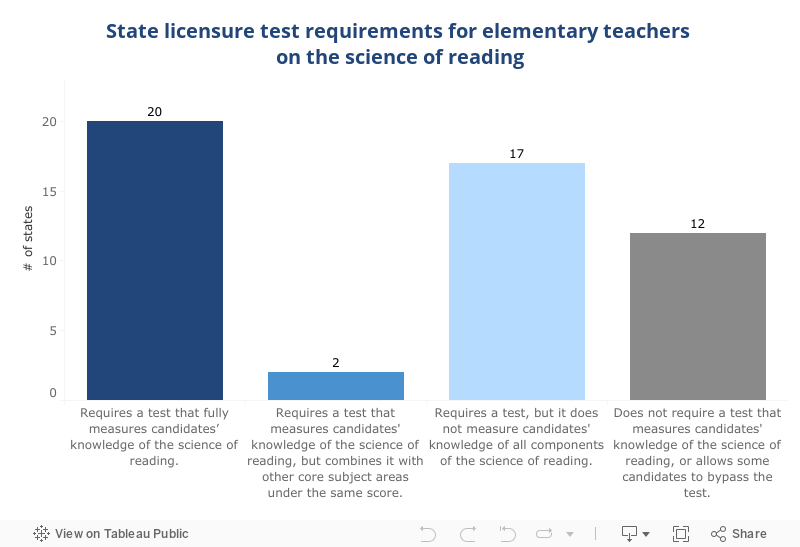
The most efficient way for states to determine that their programs are teaching essential content and that their teacher candidates are ready to teach children to read is to use a strong licensure test. Ideally, the test needs to be a stand-alone test or subtest so that high scores in other content areas cannot mask low scores in reading knowledge. NCTQ considers a test strong if it presents a faithful representation of the science of reading and fully assesses whether a teacher candidate has the knowledge to build the essential skills children need to learn how to successfully decode words and comprehend what they read.
Since 2015, four states (Alaska, Arkansas, Maryland, Texas) have transitioned to a test that will more fully address teacher knowledge of how to build the essential skills of a successful reader. (In fact, Texas contracted for a wholly new test, which our early review identified as arguably the strongest test on the market.)20
State approaches to reading tests:
NCTQ undertook a review of states’ teacher licensure exams to determine the degree to which each test aligns with the consensus scientific research about how a teacher can help the most students become successful readers.
Both commercial test publishers and states that create their own tests publish the tests’ content areas and objectives online. In the course of assessing the adequacy of exams, NCTQ accessed publicly available materials, including content outlines, test objectives, and the publisher’s candidate test prep materials. NCTQ has also been asked to review several commercially published licensure exams ahead of their release, gaining additional insight into their content.
Guiding questions include:
1. Are each of the five elements of the science of reading (phonemic awareness, fluency, phonics, vocabulary, and comprehension) adequately assessed in the test?
2. Are elements that are not supported by the science included in the test (e.g., three cueing system)?
Licensing tests that fully assess the science of reading
Certification Examinations for Oklahoma Educators (CEOE): Elementary Education Subtest I, Oklahoma
Florida Teacher Certification Examinations (FTCE) Elementary Education test*
Foundations of Reading (currently being renormed)
Indiana CORE Assessment Early Childhood Generalist test
Indiana CORE Exceptional Needs— Mild Intervention: Reading Instruction
Indiana’s CORE Elementary Education Generalist Test
KPEERI (Center for Effective Reading Instruction)
Massachusetts Tests for Educator Licensure (MTEL) Foundations of Reading test
Minnesota Teacher Licensure Examinations (MTLE) Early Childhood Education
Minnesota Teacher Licensure Examinations (MTLE) Elementary Education test, Subtest I
Minnesota Teacher Licensure Examinations (MTLE) Special Education Core Skills (Birth to Age 21)
National Evaluations Series Elementary Education Subtest I
Pennsylvania Educator Certification Test (PECT) PreK-4
Praxis Reading for Virginia Educators (5306)
Praxis Teaching Reading: Elementary Education (5204)
Praxis Teaching Reading: Elementary Education (5205)
RICA (Reading Instruction Competence Assessment), California
Texas Educator Certification Examination, Science of Teaching Reading (293) (scheduled January 1, 2021)
Licensing tests that address some but not all aspects of effective reading instruction
Idaho Comprehensive Literacy Assessment
Praxis Elementary Education: Multiple Subjects (5001) test
Praxis Teaching Reading: Elementary Education (5203) test
Praxis Elementary Education: Content Knowledge for Teaching (7811) test
Massachusetts Tests for Educator Licensure (MTEL) Reading Specialist (08) Test
Missouri Educator Gateway Assessment (MEGA): Elementary Education Multi-Content test
Licensing tests that do not address any aspect of effective reading instruction
Georgia Assessments for the Certification of Educators (GACE) Elementary Education Assessment
Illinois Licensure Testing System (ILTS) Elementary Education (Grades 1-6) [#197-200] test
New York State Teacher Certification Exams (NYSTCE) Multi-Subject: Teachers of Childhood (Grades 1-6) test
Some teachers of elementary grades may still bypass strong test requirements. In some states, teachers with an early childhood license can also teach some younger elementary grades (e.g., an early childhood license may span preschool through third grade). Because these early childhood teachers are licensed to teach elementary grades, they should be held to the same expectations as all elementary teachers, and so should also pass a test on the science of reading (in addition to meeting other requirements expected of elementary teachers). Only 11 of the 40 states in which early childhood teachers are certified to teach elementary grades require early childhood teachers to pass a test that addresses the science of reading.
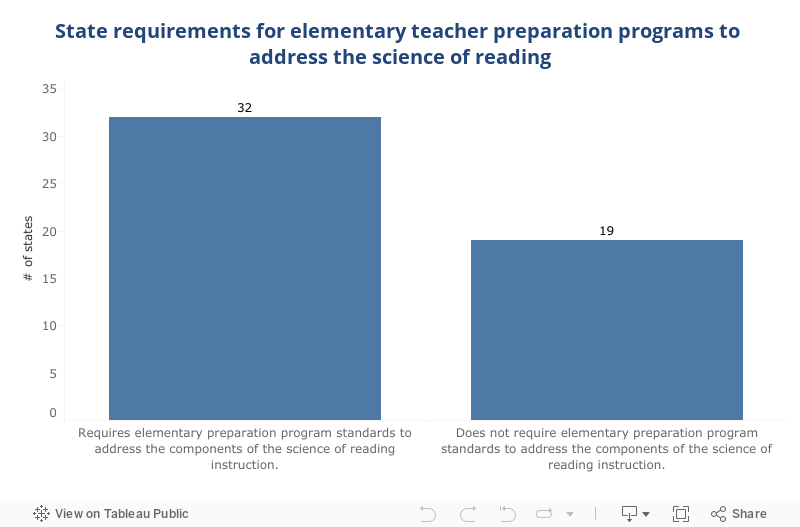
In addition to setting licensure test requirements, states can also set standards for preparation programs, requiring prep programs to address the science of reading instruction. Even in states that have a licensure test, program standards are generally enforced in the re-approval process, occurring approximately every five to seven years. The program must provide evidence to the state that it continues to meet all of the standards.
In 2020, 32 states required their approved preparation programs to address the science of reading, while 19 states did not. Of the 19 states without requirements for preparation programs, eight23 did not require a test of the science of reading or allow some candidates to bypass this test.
States often set different requirements for alternative route programs. Of the 42 states that allow alternate route programs for elementary certification, only two (Mississippi, Texas) require that all alternate route teachers pass a test that fully measures the science of reading before becoming a teacher of record. Another nine states delay the requirement until the teacher has formally completed the program, often a year or two after they start teaching. For more information, see NCTQ’s Databurst on state oversight of alternative routes into teaching.
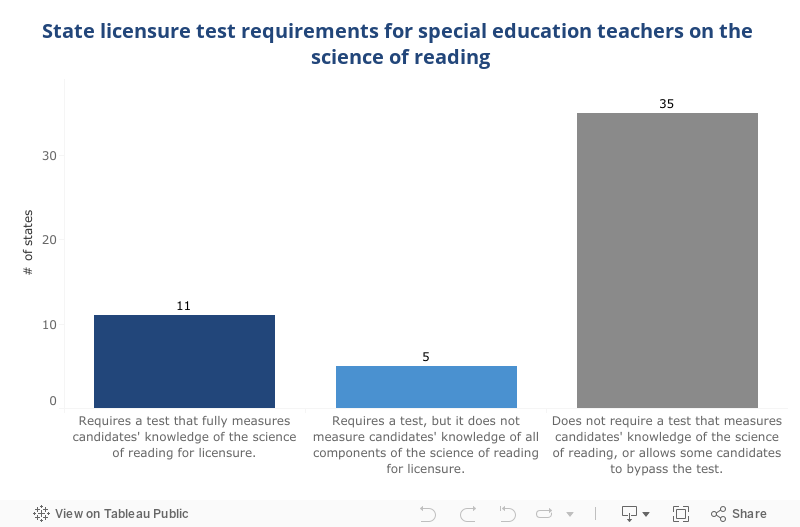
Effective early reading instruction is especially important for teachers of special education students. By far, the largest classification of students receiving special education services are those with learning disabilities, and, based on data from the U.S. Department of Education, it is estimated that reading disabilities account for about 80% of learning disabilities.24 While early childhood and elementary teachers must know the reading science to prevent reading difficulties, special education teachers, and especially elementary special education teachers, must know how to support students who have already fallen behind and struggle with reading and literacy skills.25 States should require no less from special education teachers in terms of preparation to teach reading than they require from general education teachers.26
Only 11 states require special education teachers to take a test of their knowledge of reading instruction.
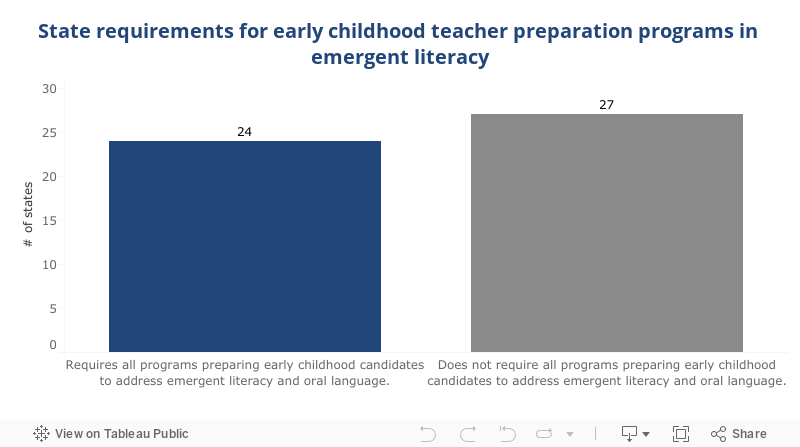
To lay children’s foundation for learning to read, and to open the door to other areas of learning, early childhood teachers must understand how to develop children’s oral language skills and build children’s emergent literacy. Especially for young children who are already behind, preschool teachers can play a critical role in language development.27 Emergent literacy encompasses a range of skills that are essential to reading, but that may not come naturally to all children. These skills include phonological awareness, phonemic awareness, learning the alphabet, and concepts of print.28 Teacher training in these areas can translate into substantial gains for children in alphabet knowledge, vocabulary, and language skills.29 The early introduction of language and literacy can make a lasting difference for children. Unsurprisingly, children with low language and literacy skills in preschool demonstrate lower reading skills in kindergarten.30 However, not all approaches to teaching emergent literacy are equally effective, and the quality of preschool curricula varies, making it that much more important that preschool teachers have ample training in how to develop their preschoolers’ emergent literacy skills.31
As communicated via a licensure test, state standards, or other state guidance, 24 states expect preparation programs for early childhood teachers to address emergent literacy.
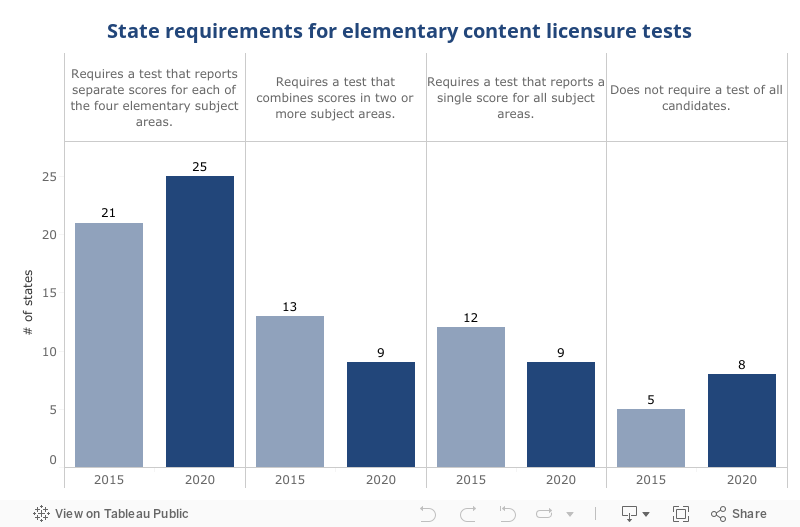
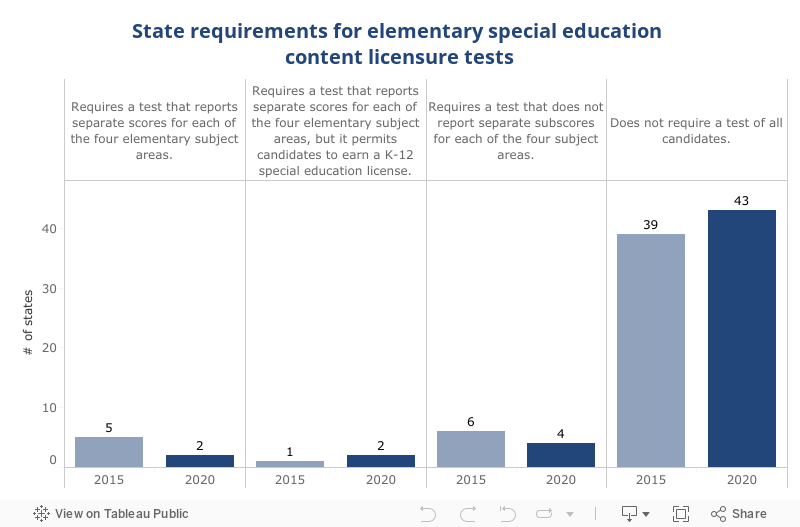
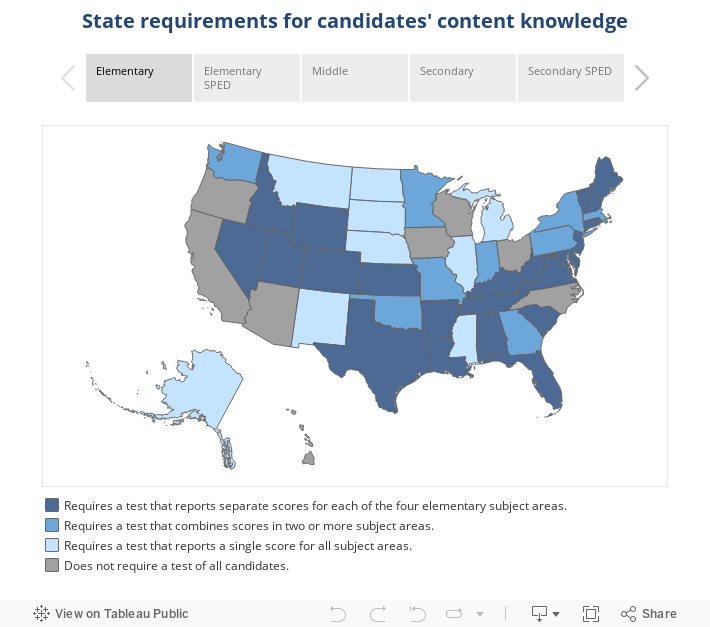
Much as learning phonics helps students make sense of the sound of words, learning a breadth of subject areas helps students draw meaning from what they read.32 Learning about the history and government of our country and of countries around the world enables students to become informed, participating members of our nation, familiar with their constitutional rights and how to exercise them.33 Learning science builds critical thinking skills and background knowledge that help students understand current events, such as climate change and health crises. Yet students now fall short of where they need to be. Low scores in specific domains of knowledge such as in U.S. history,34 civics,35 and science36 may explain in part why two thirds of American students have such low reading comprehension scores.37 To teach these subjects comprehensively, developing students’ ability to interpret and analyze information as well as clarifying students’ misconceptions, teachers themselves must be steeped in the content. Yet not all elementary teachers who reach the classroom have this core content knowledge. Less than half of elementary teachers report feeling very well-prepared to teach either social studies or science,38 and given the low performance of American fourth graders in both subjects,39 their insecurity is not misplaced.
Most of the remaining states (18) require a test that does not separately score each core area, and eight states do not require all candidates to pass any test of content knowledge.
There has been a flurry of activity in the states regarding licensure tests for elementary content knowledge. Since 2015, about a third of states (14) have changed their requirements, but, unlike the high number of states no longer using basic skills tests, there’s no net change to report.
Seven states have made changes to better measure candidates’ essential knowledge before entering the classroom: Colorado, Kansas, Maryland, Nevada, and Tennessee have strengthened their required tests, and Alaska and Montana now require a content test. On the other hand, seven states, Arizona, California, Missouri, New Mexico, North Carolina, Oregon, and Wisconsin have scaled back or withdrawn entirely from elementary content testing requirements.
Eight states offer candidates alternative ways to demonstrate content knowledge, although it is not always clear whether states reviewed evidence on the validity of these proxy measures:
* Alternative option does not apply to elementary or special education candidates
** Alternative option only applies to middle school and secondary education candidates.
Various actions by states regarding middle school content area testing have cancelled one another out in terms of defining any national trend. Minnesota now requires all candidates to pass a test in every subject they are licensed to teach, and three states that did not previously require tests (Alaska, Montana, Nebraska) now require candidates to take a test, although they can choose to take one targeted to elementary grades. However, four states (Arizona, Oregon, Utah, Wisconsin) that previously required a test no longer do so, allowing candidates to either pass a content test or meet alternative criteria. These states permit relevant work experience (Arizona), a bachelor’s degree in a relevant subject area (Arizona, Oregon, Utah), a content-based portfolio (Wisconsin), or a high GPA in the subject area (Wisconsin) to serve as an alternative indicator of a teacher’s content knowledge.
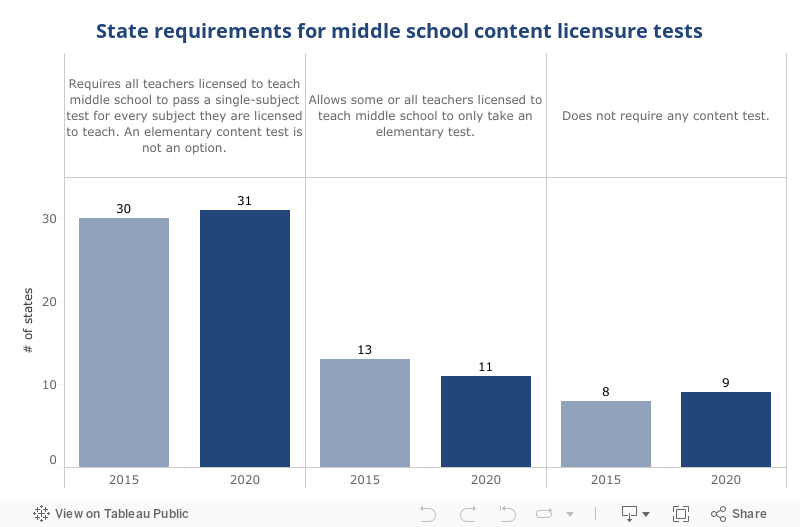
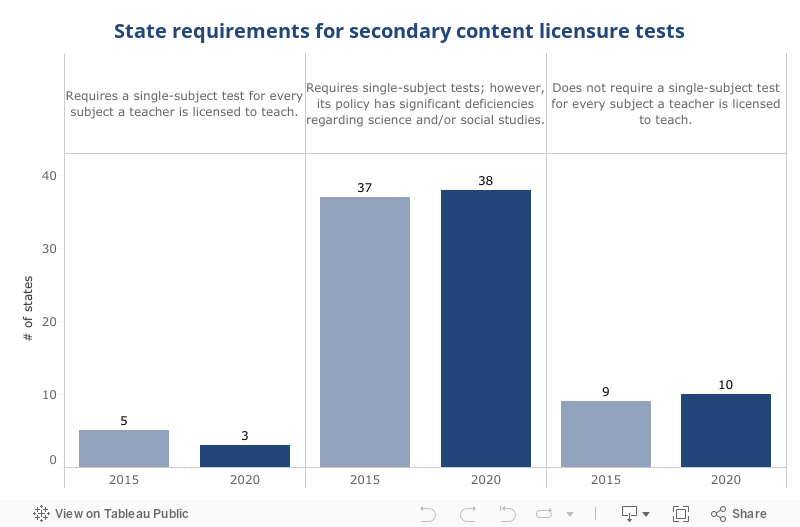
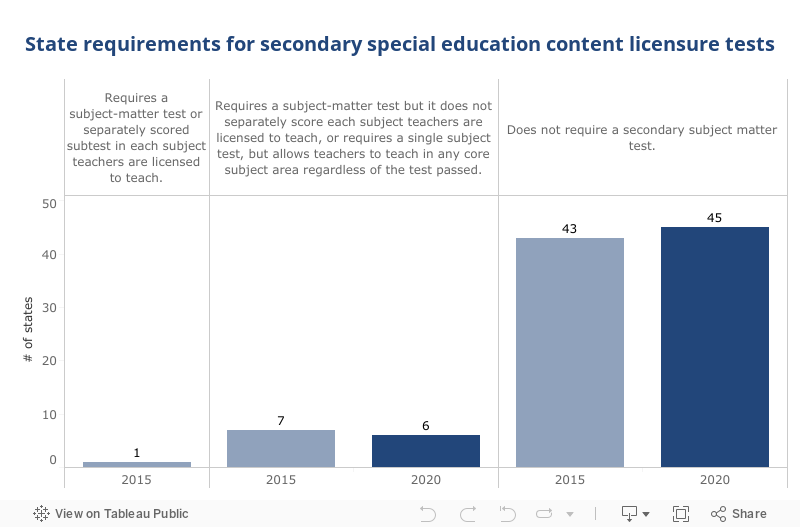
Licensing tests are most common for secondary teachers, although science and social studies teachers’ tests often come with a loophole: They allow a teacher to teach a range of areas within those subjects (e.g., a science teacher may be certified to teach chemistry, biology, and physics) without separately testing that teacher’s knowledge in each area.
At the high school level, three states (Alaska, Montana, Washington) that did not previously require a licensure test in every subject a teacher is licensed to teach now do so, although their new testing requirements for science and social studies teachers, as in many states, have real shortcomings. On the other hand, four states (Oregon, South Dakota, Utah, Wisconsin) have backtracked: They no longer require tests for every subject a teacher is licensed to teach.
Special education teachers also need to be prepared to teach core content areas so that their students with Individualized Education Programs (IEPs) can continue to learn at grade level. However, many states do not distinguish between teachers who are licensed to teach elementary grades and those who are licensed to teach secondary grades, despite the fact that, realistically, teachers cannot be expected to know the full K-12 span of content knowledge well enough to teach it. Only 11 states require special education teachers to earn either an elementary or secondary special education certification. Fourteen states only offer the overly broad K-12 special education licenses, and the remaining 26 states offer both the narrow and the broad grade span licenses.
The vast majority of states do not currently require special education teacher candidates to take a test of content knowledge to earn a teaching license. In fact, fewer states now require special education candidates to take a test than were required five years ago. The result of both broad licenses and a lack of content licensure testing means that states are, in effect, exempting special education teachers from having content knowledge.
States often set different requirements for alternative route programs. Of the 47 states that allow alternate route programs, only 13 have regulations that require all alternate route candidates to demonstrate the necessary content knowledge before admission into a program. For more information, see NCTQ’s Databurst on state oversight of alternative routes into teaching.
For full information about what each state is doing to verify teacher candidates’ content knowledge, visit the State Teacher Policy Database.
Students need teachers who not only know content, but also how to teach it in real time with all the challenges that come with a class of students. The learning curve is steep for new teachers,41 but even among first-year teachers, there’s a wide range of skills and effectiveness.42 Performance assessments are better poised to ensure that novice teachers have grasped the rudimentary aspects of how to teach before their first day of school.
States vary in their use of performance assessments.43 Some use them as a requirement for program completion (e.g., Oregon, Washington), some as a requirement for initial licensure (e.g., Illinois, Maryland, New York),44 and some require taking but not passing the test as part of their program approval process as a measure of the quality of the preparation programs themselves (e.g., Minnesota).
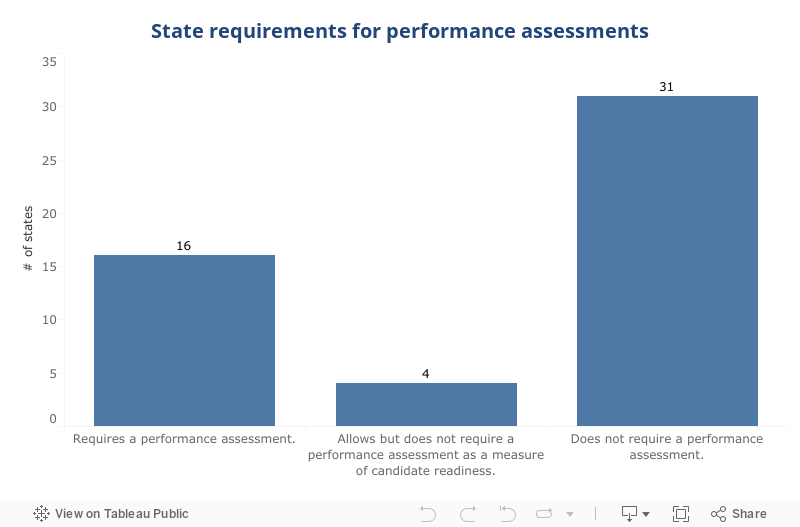
Common exams are the edTPA (required or optional in 19 states) and the ETS PPAT (required or optional in seven states).
Of the 16 states that require a performance assessment for teachers from traditional programs, 10 also require a performance assessment for teachers from alternative routes. However, because these states do not require candidates to pass the test until program completion or until the teacher earns a standard license, most alternative route teachers will be the teacher of record for a year or more before having to pass a performance assessment.
Clinical practice, often referred to as student teaching, is the best opportunity aspiring teachers have to practice and hone the skills they learned from coursework in a classroom with real students. Not only do new teachers report that student teaching was the most important part of their preparation,45 a high-quality student teaching experience can also help teachers become more effective and can be a powerful recruitment tool for school districts.46
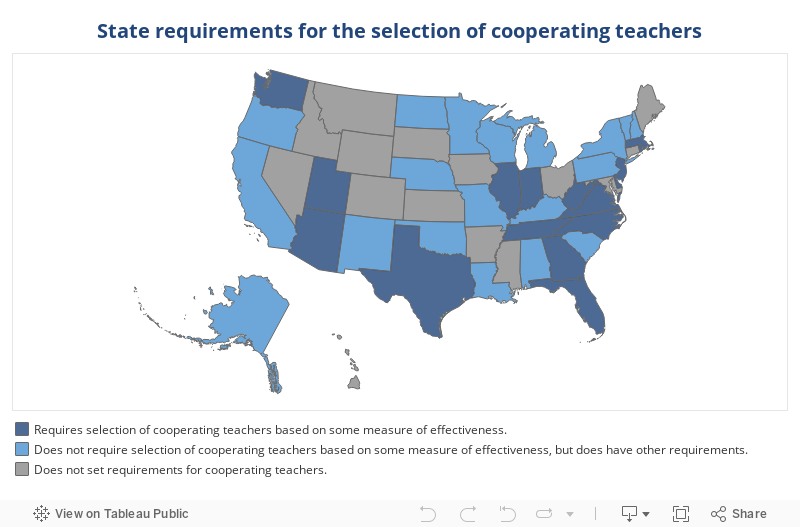
In fact, first-year teachers can be as effective as typical third-year teachers by spending their clinical practice in a classroom of a highly effective teacher.47 However, cooperating teachers are often chosen for factors other than their effectiveness, such as their willingness to host a student teacher, their years of experience, or even their own struggles managing student behavior.48
In total, 16 states now require cooperating teachers to be selected based on some measure of effectiveness. An equal number of states do not set any requirements for cooperating teachers, while the remainder (19 states) set requirements on criteria other than teacher effectiveness.
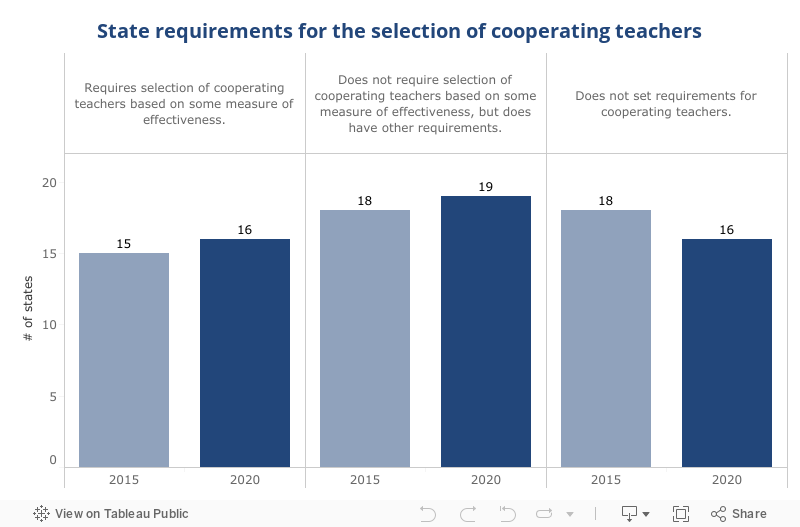
In total, only one additional state since 2015 now requires cooperating teachers to be selected based on effectiveness. However, this net count obscures substantial activity in this area. Four more states require cooperating teachers to be selected based on effectiveness (Texas, Virginia, Washington, West Virginia), while three have removed this requirement (Arkansas, New York, Oregon).
States often set different requirements for alternative route programs. Of the 47 states that allow alternative route certification, 27 have specific requirements for mentoring and induction for alternative route teachers. For more information, see NCTQ’s Databurst on state oversight of alternative routes into teaching.
This edition of State of the States focuses on key state policies related to teacher preparation in terms of state guardrails for approved programs and what teacher candidates must do to qualify for a teaching license. In a period when states have been genuinely concerned about teacher shortages, many have chosen to eliminate or compromise their policies directed at the quality of the teacher workforce, often making the expedient choice. However, not only can choosing quantity over quality cause more harm than good, it may be altogether unnecessary. States could consider alternative policy solutions that would not only address teacher shortages and expand the diversity of the workforce—two clear priorities for states—but that also would not imperil teacher quality.
Three areas rise to the top for special consideration by states, as each provides alternatives to some of the more popular but less advantageous choices states have made since 2015.
Since 2015, many states have retreated from using academic standards in the teacher preparation program admission process. A significant number of states (10 out of the 25 that had a policy in place in 2015) scaled back their requirement that applicants pass a test of their reading, writing, and mathematics skills.
While these actions were taken in response to the pressing need to diversify the profession or to ease potential teacher shortages, they may not help solve those problems. In fact, nearly 200 teacher prep programs across the country are both selective and diverse. Teacher candidates, regardless of whether they are able to pass a basic skills test for admission into a program, almost always still need to pass licensure tests administered at the end of their course of studies. How a candidate performs on a basic skills test serves as a strong predictor of performance on both content licensure tests and performance assessments.49 The same candidates who would have struggled to pass the basic skills test may have difficulty passing the content licensure test. In effect, states may be boosting the size and diversity of enrollment in teacher preparation—but not of the teaching profession itself.
Some states have instituted “proxy” measures to determine the reading, writing, and mathematics skills of teacher candidates.50 However, to our knowledge, few states have first determined whether these alternatives serve as adequate measures of a candidate’s abilities. Many of the proxies currently in use may not be capable of fulfilling the role they have been assigned.
States struggling with this issue might consider the more careful approach taken by Massachusetts, which contracted for an independent study to assess whether the state’s licensure tests do predict future teacher effectiveness (they do), and whether the tests are as predictive of how well teachers of color will perform in the classroom as white teachers (they are).51 States have an obligation to verify that their testing regimes are serving the public good, and if they are not, they should be abandoned or significantly revised. Massachusetts also launched a three-year pilot to determine whether alternative assessments to the communication and literacy skills and subject-specific Massachusetts Tests for Educator Licensure (MTELs) could serve as a reliable measure of a candidate’s future effectiveness.52 A pilot of that nature, without making a more permanent decision affecting all, will serve the interests of the state.53
Fortunately, the need for teachers to know how to teach children to read has become a topic of urgent concern in many states. Four states (Alaska, Arkansas, Maryland, Texas) serve as bright spots with their decisions to transition to licensure tests that are more reflective of the knowledge teachers need. Twenty states currently require elementary teachers to pass what we identify as high-quality tests. Only 11 states require high-quality tests of special education teachers.
A licensure test that fully and faithfully measures knowledge of the science of reading offers the best leverage a state has regarding what their approved teacher preparation programs teach about reading instruction. However, few states use that leverage effectively—even some states that have adopted a high-quality test—because states often compromise on the minimum passing scores so that more candidates will pass, thus diluting the purpose of the assessment in the first place. For example, eight states use the Foundations of Reading test, but states’ required minimum passing scores range from 220 to 240. Some states offer candidates alternatives to having to pass the test, or they do not hold programs accountable for what is arguably the most important aspect of preparation there is—how to teach reading.
We identify four essential steps to ensure that licensure tests of reading knowledge produce the outcomes states seek:
State action since 2017 is brighter on this front, with 25 states now forging policies to bring more candidates of color into the teacher pipeline. Arkansas has led the way as one of only a few states to publicly state a specific goal of increasing the diversity of the workforce by 25% by 2025. The state also requires preparation programs to provide a list of teachers of color who completed licensure programs and, with the licensees’ consent, include their contact information in a central database that is available to every public school superintendent. States are also targeting candidates early on in high school and offering funding and mentoring.
Other state actions that bear repeating include Maryland, which initiated a digital recruitment effort aimed at attracting the top 25% of high school students to diversify the teacher workforce, and New Jersey, which launched a grant program to universities that offers funding and support for aspiring teachers of color.
One of the most fruitful strategies states could deploy is to increase the number of teacher candidates of color who not only enroll in but successfully complete their program of preparation.54 A potential hurdle to program completion is licensure tests, which have recently come under fire as some candidates reach the end of their preparation program but cannot pass the test necessary to become a licensed teacher. Candidates of color are hit hardest by low passing rates on licensure tests.55
The answer is not to remove the tests, as they are the most efficient, scalable way to measure the breadth of content knowledge and other core knowledge and skills in a way that is comparable across programs. Instead, to tackle this problem, states must collect the data necessary to better understand this challenge, and then work with preparation programs to strengthen support for candidates. Low passing rates on content knowledge tests are largely driven by inequities in the K-12 education system. But with support and guidance from their state education agencies, preparation programs are in the best position to remedy this problem, not just through remediation efforts but also more explicit guidance on the coursework that aligns with what candidates will need to know and do to pass licensure tests and be effective in the classroom.
Three steps to improve enrollment and program completion rates for Black and Hispanic students:
In the past year, many states have had to adjust their requirements for entry into the teaching profession to accommodate the very real challenges posed by the pandemic. However, as the pandemic begins to fade, so, too, will the disruptions—but not, unfortunately, the damage done to student learning. Students will emerge from the pandemic needing teachers who are ready to make up for lost time. States can avoid compounding some of this damage through faithful adherence to the policies that can best ensure that new teachers enter the classroom thoroughly prepared to meet their students’ needs.
Kate Walsh, Shannon Holston, Hannah Putman, Patricia Saenz- Armstrong, Elizabeth Ross, Kency Nittler
Kelli Lakis, Lisa Staresina
Nicole Gerber, Ashley Kincaid, Andrea Browne Taylor, Christie Ellis
This report is based on research funded by the following foundations. The findings and conclusions contained within are those of the authors and do not necessarily reflect positions or policies of the project funders.
Bill & Melinda Gates Foundation
Daniels Fund
The Joyce Foundation
Walton Family Foundation
The following documents provide a state-by-state breakdown of state’s requirements for teacher preparation programs.
Requirements for admission into teacher prep programs
Support for diverse enrollment in teacher prep programs
Requirements for knowledge of early reading
Requirements for knowledge of content areas