Cite this report
Saenz-Armstrong, P. & Holston, S. (2021). State of the States 2021: Teacher Supply and Demand. Washington, D.C.: National Council on Teacher Quality.

Saenz-Armstrong, P. & Holston, S. (2021). State of the States 2021: Teacher Supply and Demand. Washington, D.C.: National Council on Teacher Quality.
For any labor market to function properly, clear information is needed to guide decision making; its absence invariably leads to less than optimal decisions and inefficiencies.1 While the broader labor market is riddled with imperfect information, the teacher labor market is particularly vulnerable—largely for the lack of the most basic information.
In this analysis, the latest edition in our State of the States series reviewing states’ teacher policies, we examine the essential role of state education agencies in collecting and reporting information about their own teacher labor markets in the following areas:
Compared to most labor markets, the teacher labor market is highly localized,2 meaning that the hiring decision processes usually happen within the confines of small geographical areas, often blind to the existing resources and needs of nearby localities. This hyperlocalization limits job opportunities for teachers and hiring opportunities for schools and exacerbates inequities across school districts, which is why states play such an essential role in the generation and provision of information, given their broader scope and perspective. States’ data reporting can apprise districts of the available teacher talent across the state and provide them with a broader view to help them fashion appropriate policies to respond to the issues that exist within their own teacher labor market. The availability of good state data helps to ensure not only that classrooms are fully staffed, but also a more equitable distribution of teacher talent across the state.
As there is a wide and uneven distribution of technical capacity and practices among the consumers of this information,3 this brief also examines how state education agencies help make this information both available and functional for their end users.
The first prerequisite for an optimal allocation of teacher talent is knowing where and what type of teacher talent is 1) available, and 2) needed.4 A centralized reporting system managed by the state education agency showing the available new supply of teachers and their characteristics that can be matched with districts’ needs for those teachers is an important tool to begin solving the teacher shortage problem faced by some localities.
Much has been written about a “national” teacher shortage, though largely absent the data needed to quantify the genuine extent of the problem. On one end of the spectrum there are those that suggest that the teacher shortage problem is a large and generalized one5 and that there is a need for across-the-board policy solutions that encourage the building of a larger teacher workforce. At the other end are those who suggest that across-the-board policies that are designed to tackle a generalized teacher shortage6 do little to address individual and localized teacher shortage problems.7
The latter position is gaining more traction as more states collect and report teacher shortage data that reveals their specific shortage areas. It emphasizes the need to have a real information tool that provides the actual data to inform if and where localities are seeing teacher shortages and surpluses.8
In light of this need, we review here how states currently inform the teacher labor market by making available to the public 1) both supply and demand information that is 2) sufficiently disaggregated and 3) connected. The ability of a state to meet all three of these data requirements means that:
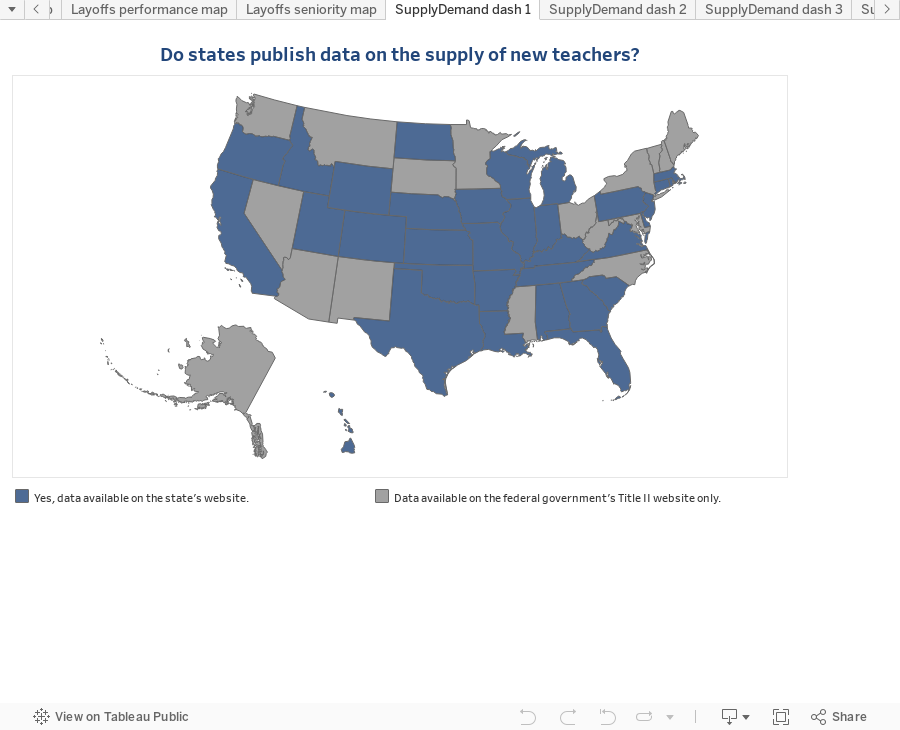
One of the most important elements of the teacher supply is the production of new teachers, generally but not exclusively the purview of the nation’s colleges and universities. All states must comply with federal reporting requirements under Title II of the Higher Education Act,9 collecting and submitting data on new teacher production or supply to the U.S. Department of Education (US ED).
Not all states choose to publish the information that they turn over to US ED on their own websites. The following map shows that 18 states do not publish teacher supply data on their website in spite of collecting the data to fulfill Title II requirements.
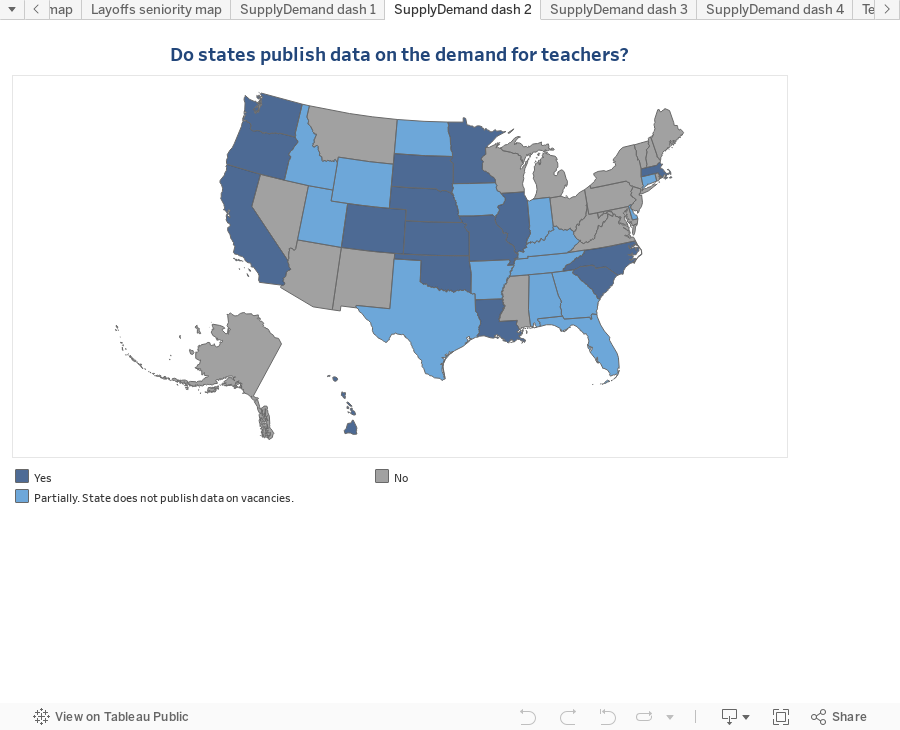
The availability of teacher demand data is much less prevalent than production data. As depicted in the following map, only 16 states publish the major components of teacher demand data, which would include the number of teachers in the existing employed workforce (the portion of the teacher demand already met by existing teacher supply), vacancy rates, the number of new hires, and, ideally, the prevalence of teachers being assigned to teach courses outside their certification areas.
Of the remaining 35 states, 13 states publish some data on teacher demand, though each missing key elements, most often related to existing vacancies. In most of these cases, the only data available is the number of teachers in the existing employed workforce, meaning that from year to year net changes can be attributed either to attrition or new hires, but it is not possible to disentangle the two. For example, Tennessee reports data that says that in 2020 the state had 39,563 elementary school teachers up from 39,252 in 2019. What we cannot learn from this data is whether only 311 new teachers were hired, or whether there was also some degree of teacher attrition in 2019 and the number of new hires was actually larger. From this data we also do not know whether there were more openings than hires or that some openings went unfilled.
Of the 13 states that publish partial data on teacher demand, nine are able to indicate the percentage of teachers teaching out of field with a subset of five states—Alabama, Arkansas, Georgia, North Dakota, and Wyoming—also reporting on teachers with provisional credentials (i.e., not fully certified). In none of these cases is this data connected to vacancies. State reporting on how many vacancies relate to new positions, versus those aimed to properly staff a position currently covered by an out-of-field or not fully certified teacher, would give a fuller picture of the teacher shortage, and allow districts to better define hiring strategies and teacher talent allocation.
Even though more than half of states produce both teacher supply and demand data at some level, the utility of their datasets is limited, making it difficult to identify where there are shortages and in which subjects. Many state reports are circumscribed to state-level data only and report teachers in broad categories regardless of certification area (e.g., Elementary or Secondary).
Data not disaggregated at the district level, or at least a regional level within the state, is not able to accommodate the local nature of the teacher labor market. For example, the labor market for schools in western Massachusetts is quite different from the market in the Boston area, so a state database that combines the two masks the genuine shortages in the western half of the state. Fundamentally, the misalignment of teacher supply and demand is a local problem, needing data at the local level in order to support local solutions.
Data that does not break down teachers into their certification area also has less utility. Data by certification area allows districts to create more accurately targeted recruitment and retention policies, such as the choice of teacher preparation programs from which to recruit, creating a special student teaching or residency program targeted at the area of shortage, or additional pay for hard-to-staff subjects. With this type of disaggregated data, teacher preparation programs can also help to fill the gaps between the teacher supply and demand, as they advise and prepare teacher candidates, with better awareness of teaching fields in high demand in their locality, or with oversupply of teachers and higher levels of unemployment.
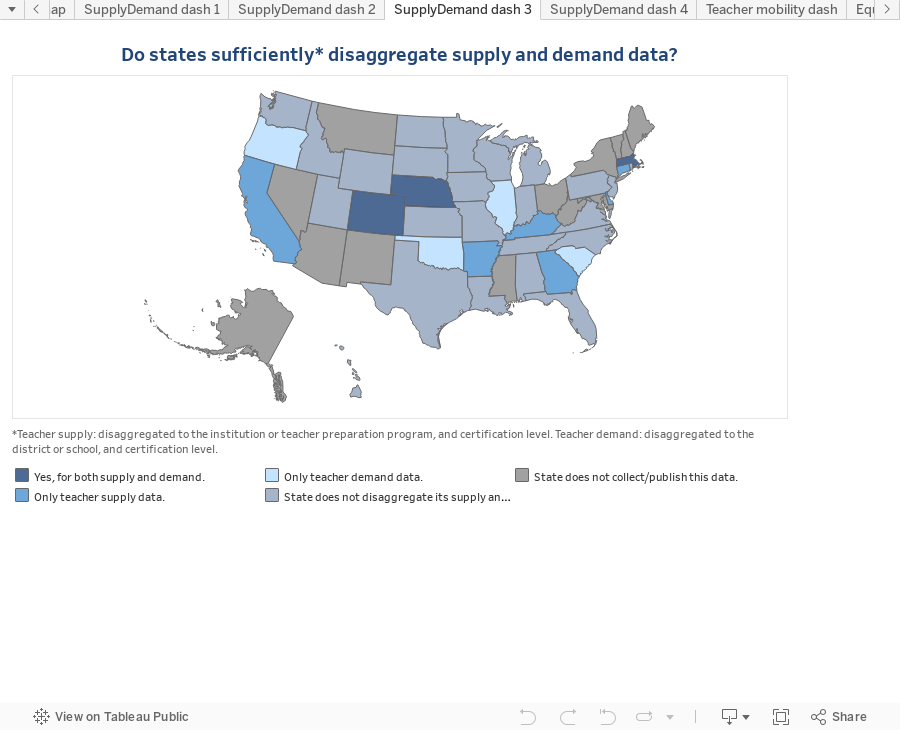
Only three states produce and make available teacher supply and demand data that is disaggregated both at the district and certification levels: Colorado, Massachusetts, and Nebraska. Until 2018, Maryland published one the most complete reports on teacher supply and demand in the nation, but no longer does so.
Nebraska produces teacher supply reports with data on completers by institution and certification type, while on the demand side the state produces a detailed report on teacher vacancies by endorsement area and region.
Massachusetts produces a dashboard with information about the new teacher supply, their employment and two-year retention rate, as well as detailed information on the current teacher workforce by district, grade level, and subject, including data on teachers who are not fully licensed.
Colorado also produces a supply dashboard with information on new teachers’ employment, performance data, and retention rates. On the demand side, Colorado also publishes information about open positions by endorsement area, geographic location, and school district. The one caveat about Colorado’s data is that, on the supply side, the latest information available is for the school year 2018-19, which limits the state’s ability to provide its data users a full picture on immediate teacher shortages.
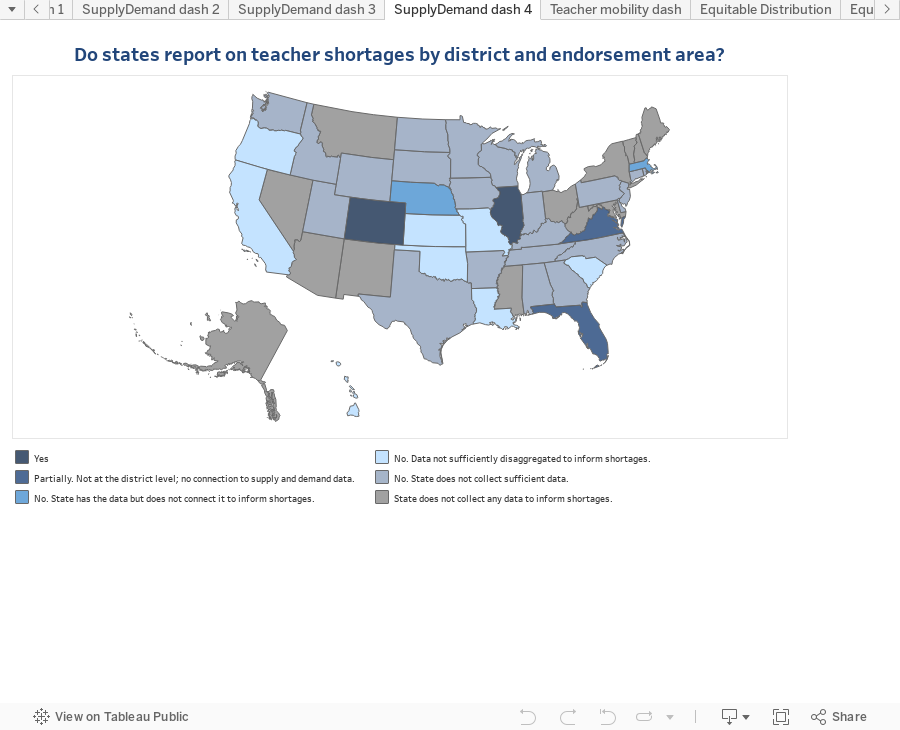
Only four states produce an annual report on teacher shortages: Colorado, Florida, Illinois, and Virginia. While Colorado’s and Illinois’ shortage calculations use disaggregated data that is also made available to the public, the critical shortage areas reports that both Florida and Virginia publish are not disaggregated by district nor linked to the underlying data, preventing policymakers from knowing where shortages are in the state, their magnitude, as well as the capacity of local teacher preparation programs to supply the teachers that are needed.
Colorado’s Educator Shortage dashboard and accompanying database, paired up with the aforementioned new teacher supply dashboard, provide a clear picture of exactly where the greatest needs are, and help direct both districts’ and teacher preparation providers’ efforts for the production and recruitment of teacher talent. Colorado also has a new mapping tool that links together district level shortages and teacher preparation program completion to inform the dynamics of the teacher labor market.
Similarly, Illinois’ Educator Supply and Demand dashboard brings together supply and demand information, and informs the public on the hiring needs and unfilled positions in different school districts and regions. The only caveat about Illinois’ data is that the new teacher production data is not disaggregated at the institution or program level, which does not allow for a clear response by the teacher preparation providers to the certified personnel needs of the state and districts.
Teacher retention is certainly not uniform across the country nor within a state. Differences in retention rates have been found between urban and rural school districts, but also across urban schools.10 Retention rates have been associated with working conditions,11 but also with organizational characteristics.12 Different rates and reasons of attrition will require different policy interventions.13 It is also important to differentiate between mobility (teachers leaving for new employment in another school or district) and attrition (teachers leaving the state teacher workforce),14 as they too require different retention strategies.
Supporting effective retention strategies requires access to vacancy data that disentangles teacher turnover from districts’ decisions to expand the number of teaching positions. In other words, two data elements need to be captured: 1) how many new positions are being created by the school districts in a state that need to be filled, and 2) how many positions need to be filled due to teacher attrition. Teacher attrition and mobility data not only informs this second element, but provides insight about districts’ practices or characteristics that could affect their ability to retain effective teachers.
In light of these differences, we analyze the following: How do states inform the teacher workforce, including prospective teachers and educator preparation programs, about the mobility and attrition that occurs in different districts and their reasons?
A review of states’ data reporting systems reveals that only 20 states track and publish teacher retention and mobility data.
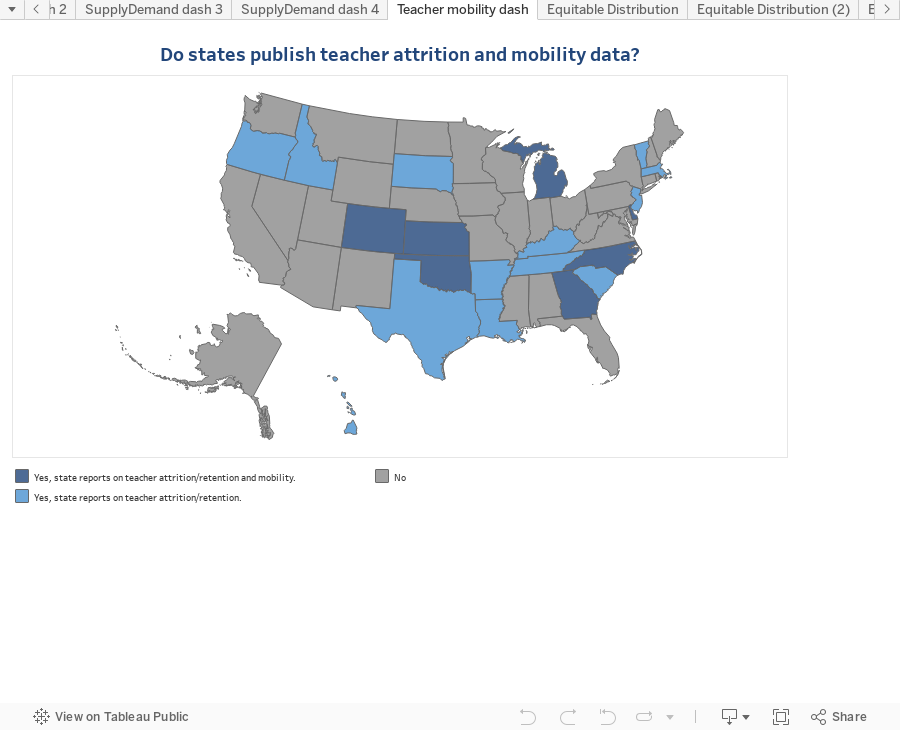
Among the most notable states, as mentioned earlier, is Colorado, which informs not only on overall teacher retention but also specifically on the retention rate of new hires.
Delaware, through its open data initiative, provides information on teacher mobility both within districts and for teachers moving to other districts, as well as those who left and did not return to work in the state, disaggregated not only by school and grade, but also the teacher’s race, gender, and experience level (i.e., novice vs. experienced).
Michigan produces a very detailed report on teacher mobility that differentiates between mobility and attrition, and includes policy recommendations.
North Carolina’s report, State of the Teaching Profession in North Carolina includes a unique analysis on teacher turnover that differentiates the data according to who initiates the employee separation (the school district or the teacher) and reasons for that separation. The report also differentiates between attrition and mobility, and disaggregates the data by region, years of experience, and effectiveness ratings.
With some exceptions, research finds that the teacher workforce has long been characterized by the inequitable distribution of teacher talent,15 not only in terms of demographics but also when it comes to access to effective teachers.16 Therefore, aside from knowing where and how much teacher talent is available and needed, the optimal allocation of teacher talent requires considerations of educational equity, accounting not only for an adequate supply, but also how teacher talent is distributed according to key characteristics such as race and effectiveness.
States’ data reporting policies ought to reflect their equity goals. Reporting the distribution of both diverse and effective teachers among schools and districts can be quite consequential to the allocation of teacher talent, as well as help schools and district leaders devise retention tools specifically directed towards the type of teachers that are most needed.
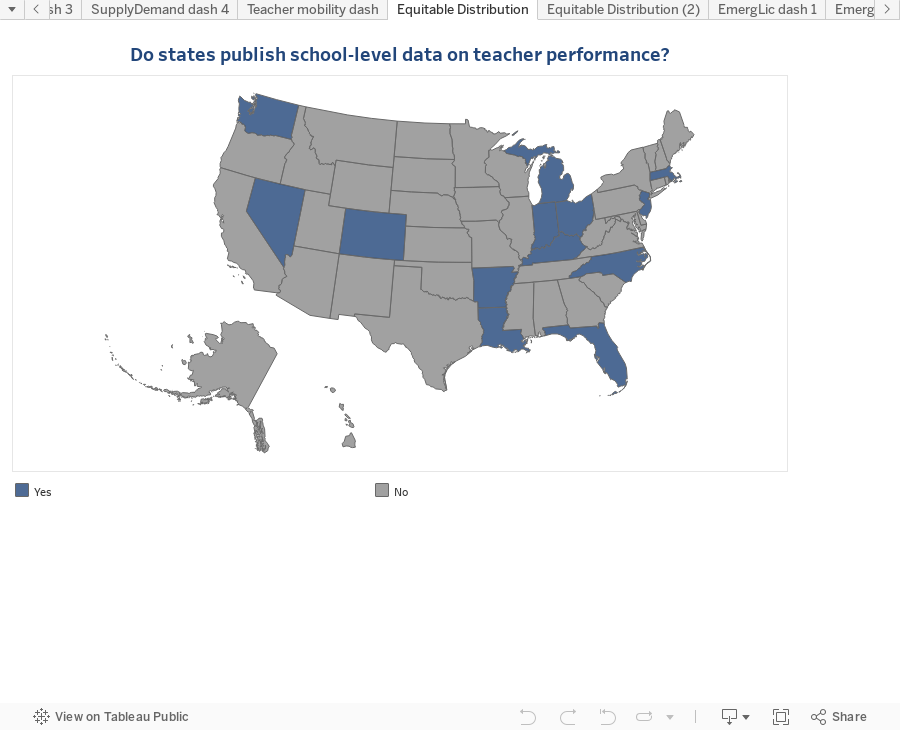
The analysis of states’ efforts in this department reveals that only 13 states make school-level aggregate teacher performance data publicly available, consistent with applicable privacy constraints.17 The heterogeneity of needs between schools in a single district makes school-level data important in this case.
A forthcoming NCTQ report (January 2022) will further unpack how states are meeting the intended goals in ESSA to ensure that low-income students and students of color are not disproportionately served by 1) ineffective, 2) inexperienced, or 3) out-of-field teachers.18 That report will document the wide variability in what states report and how they report it, with only 20 states publicly reporting data on all three data points.
While not included in ESSA reporting requirements, states have an opportunity to advance progress on teacher diversity19 and equitable access to teachers of color20 by enhancing the quality of their data collection efforts in this regard. Currently 20 states do not collect the race of their teacher population, making it difficult to measure progress on diversifying the teacher workforce.
Colorado again leads the way by providing teacher effectiveness data at the school, district, and state levels, as well as how those numbers change over time. Furthermore, Colorado also provides a district-level analysis reporting on gaps between the percentage of teachers rated effective or higher in schools that serve high and low proportions of students in select demographic groups.
Kentucky’s school report cards also provide information on the faculty profile by school, including students taught by inexperienced, ineffective, or out-of-field teachers.
Arkansas’ report cards not only report on teacher effectiveness but also on the percentage of teachers teaching out-of-field, provisionally licensed, inexperienced, and those teaching with licensure exceptions. School report cards also contain the percentage of effective teachers serving economically disadvantaged students.
When it comes to informing the teacher labor market, states have a unique vantage point that allows them to illuminate the inequities and inefficiencies of local labor markets through timely, accurate, and sufficiently disaggregated data, as well as making connections that individual stakeholder (i.e., policy makers, teacher preparation program or district leaders, hiring managers, school administrators) cannot.
In order to give education policymakers and local leaders the actionable information they need to address supply and demand issues, and based on what the leader states in each field are currently producing, the ideal state information policy tool would:
Ultimately, it will be this second set of information that will be the most actionable for decision makers, as it offers a clearer view of the connections between teacher supply and demand and sheds light on where those variables are misaligned, therefore providing a starting point for the analysis of the causes of their misalignment.

This data reporting analysis includes data that is reported on individual state websites and does not include any data that is reported to the federal government.
Dr. Patricia Saenz-Armstrong
Shannon Holston
Kelli Lakis, Lisa Staresina
Nicole Gerber, Ashley Kincaid, Andrea Browne Taylor
This report is based on research funded by the following foundations. The findings and conclusions contained within are those of the authors and do not necessarily reflect positions or policies of the project funders.
Bill & Melinda Gates Foundation
Daniels Fund
The Joyce Foundation
Walton Family Foundation