
Consumer prices are growing at rates not seen during the last decade, and in
January 2022 the national inflation rate reached 7.5%, a record high in the last 40 years. Inflationary concerns have spilled over into many sectors of the U.S. economy with wages losing some of their purchasing power, but the public K-12 education sector seems particularly vulnerable to this loss.
In the country’s public K-12 schools, as in other public services, salaries are not a product of supply and demand forces, but rather a matter of collective bargaining and public policy. Therefore, public school teacher salaries do not respond swiftly to the pressures of the economy, as recent headlines reflect.
To analyze whether or not teacher salary increases have kept pace with the consumer price increases, this
District Trendline compares the last four years of raises provided by the largest district in each state1 against the regional inflation rate.
How big were recent teacher raises?
In most of the districts of our nation, and unless some kind of freeze is enacted by the district authorities, K-12 public teachers commonly receive two types of salary increases each year: a cost of living adjustment (COLA) and a ‘step’ increase, a raise in pay for another year of teaching experience. (Districts can also offer multiple types of bonuses or differential pay that might also increase over time, but for the sake of this analysis, we only consider those two basic salary increases.)
To illustrate these increases, let’s consider a teacher who is placed on Step 1 of the district’s Year 1 salary schedule. In the following year, Year 2, this teacher will typically move to the second step of the district’s Year 2 salary schedule, which is generally adjusted for cost of living.
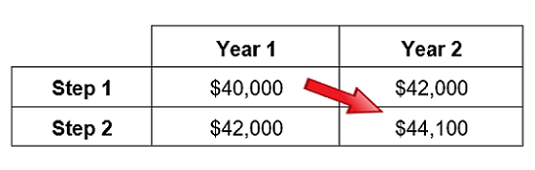
In this example, the teacher received a 5% raise due to additional experience as well as a 5% COLA adjustment, a combined 10% salary increase.
Of course the amount of these raises varies significantly across districts. Among the largest districts in each state, teachers’
combined three annual salary raises (or how much their salary grew due to COLA and step raises between 2017-18 and 2020-21 school years) ranged from as little as 4% in Laramie County School District 1 (WY) to over 30% in Detroit Public Schools Community District (MI). The median raise among these districts for those years was 12%, equivalent to an annual raise of 4%.
Is 4% too little? Is 30% too much? In July 2021, NCTQ took
a look at the teacher salary competitiveness, but here we ask: How competitive are public school teacher salary raises? In other words, how do these salary raises compare to those of other professionals?
To get a better sense of how competitive these raises are, we compared these rates to the 10.5% raise a similarly-compensated average federal employee would have received for the 2017-2020 period.2 As shown in the graph below, 32 of the 51 districts analyzed gave their teachers salary raises that are similar or higher than what our benchmark federal employees received. It is worth noting that, even though private sector employment was more volatile during the same period due to the recession and the pandemic, according to the Bureau of Labor Statistics, private industry wages and salaries increased a similar percentage during the same period: 9.2%.
But what about inflation?
Inflationary concerns are very valid, but it would be a mistake to compare all teachers’ salary raises with the current national rate of inflation (7.5%). Prices in all regions in the U.S. did not rise uniformly, and thus salary increases that result from changes in local teacher salary schedules ought to be compared with the local inflation rate, not the national average.
The following graph shows the salary increase that teachers received, adjusted for regional inflation rates, between 2017 and 2020. This is important because it is indicative of raises due to experience, but it also tells us whether teacher salaries have lost, retained, or improved their purchasing power.
This adjustment changes the picture dramatically: the lowest raises aren’t the lowest anymore, and there is a reshuffling at the top as well. The
inflation-adjusted total salary raises for teachers range from 0.5% in Bismarck Public Schools (ND) to close to 28% in Milwaukee Public Schools (WI).
Notably, every district in this sample offered raises that outpaced inflation during this four-year time period. Even raises in districts like Laramie County outpaced inflation, because their locality experienced almost no inflation over the 2017-2020 period.
Overlay the inflation-adjusted 4.6% raise for the average, similarly-compensated federal employee, and now 39 out of the 51 districts either provide comparable raises or outpace the federal rate.3
But what about this year?
Inflation has certainly become more of a concern this year. NCTQ will soon publish current salary information for the largest district in each state, but here we provide an early look with a sample of 24 districts to examine how district salary increases are currently matching up to this year’s high inflation rates.
Of the 24 large districts for which we have current salary information, 11 gave their teachers raises that either kept pace or surpassed their regional inflation rate, while the remaining 13 did not, resulting in a net (inflation-adjusted) salary reduction among the 24 districts.
Worth noting:
Teachers in the
School District of Philadelphia (PA) received a salary increase during the 2021-2022 school year of 7.5%, while their local inflation rate amounted to 2.6%. Similarly, LAUSD raised their teachers’ salaries by 7.4%, and the local inflation rate rose to nearly 4%.
On the opposite end,
Jefferson County Public Schools (KY) teacher raises did not appear to keep up with inflation this year, but the district veered from its standard two-raise policy this year in order to address their more immediate staffing priorities. Instead of their typical salary raises, the district relied on $5,000 return-to-teach stipends to attract teachers back into the classroom, which are being paid out in three installments, provided teachers remain in the classroom. This bonus represents between 6-10% of teacher salaries according to their 2021-22 salary schedule, which is on par with the locality’s 6% inflation rate. Other districts throughout the country also opted for some combination of salary raises and one time lump sum bonuses to incentivize teachers to return to the classroom this year; these bonuses are not included in the calculation of teachers’ raises shown here.
Not depicted in the following graph is
Miami-Dade County Public Schools (FL), one of only a few districts in our sample to not offer their teachers automatic ‘step’ raises based on experience, and instead offer salary increases based on teacher effectiveness. Therefore, it would be inaccurate to assess teacher salary raises in this district based only on COLA adjustments, since it is likely that teachers qualified for larger raises not captured in their salary schedule nor in this analysis.
According to the latest data from the Bureau of Labor Statistics (BLS)
Employment Cost Index (which measures changes in compensation over time, independent from workforce changes), the wages and salary index of all private industry workers rose 5% last year, compared to an average of 4.5% in our sample. This is only slightly larger than the average 2021 inflation of 4.7%. Regional data for this index has not yet been released by the BLS. In the public sector arena, comparable GS-9 employees received an average salary increase of 2.1% in 2021, lower than the year’s average inflation rate.
Conclusion
Over the last few years, teachers’ salary increases in large districts across the U.S. have mostly kept up with inflation, and on average, the size of inflation-adjusted salary increases that teachers receive are relatively competitive when compared to other public servants across the country. This is not to say that teacher salaries are overall competitive, but rather that on average, inflation has not been one of the biggest concerns when it comes to teacher pay. This year, however, salary increases in large districts appear to have lagged behind inflation more often than not, which effectively reduces a teacher’s salary purchasing power.
Competitiveness remains a significant concern, and although more states and districts have implemented differential pay over the last years to better attract talent, school districts’ salary schedules still contain a fair amount of rigidity and are not often responsive to the teacher labor market.
If inflationary pressures do not subside, school districts need to consider stepping up their COLA raises, so as to not detract from their teachers’ wages’ purchasing power. One way to free up resources to accomplish this would be to move away from traditional step and lane salary schedules that often
unnecessarily reward the attainment of masters degrees, which on average do not appear to contribute to a teacher’s effectiveness. Doing so would not only free up some funds that the district could use to stay competitive, but would also introduce much needed responsiveness into public teacher pay to attract the talent that the district needs.
Endnotes:

More like this

Pay increases and other non-obscure strategies to address the substitute teacher shortage
How several large school districts are revisiting policies surrounding pay and health benefits to attract prospective substitute teachers.

Upping the ante: The current state of teacher pay in the nation’s large school districts
As we close in on one year of the COVID-19 lockdown, we examine how resources are being used to recruit and retain effective teachers.
Endnotes
- Metropolitan Nashville
Public Schools, the second largest school district in Tennessee, was used in
place of their largest, Shelby County Schools, due to Shelby County’s lack of available
salary schedules for all the years included in this analysis. - The salary schedule used to establish this comparison is the “Rest of the U.S.” GS scale, which is the salary schedule that applies to federal employees in most of the U.S. except for those who reside in selected localities that, due to cost of living, require their own salary premiums. About a quarter of districts in this sample line up with localities with their own federal salary schedule, but for this analysis, we compare only against the “Rest of the U.S.” scale. In 2017, on average, the salary of teachers across the 51 large districts in this analysis during their first 20 years of experience roughly paralleled the “Rest of the U.S.” GS-9 scale for a similar number of years of service. Therefore, we examine the raise an average GS-9 employee would earn over this period. According to federal guidelines, an average performing employee starting in 2017 at GS-9 Step 1 would have been placed at GS-9 Step 4 in 2020. The frequency of step increases diminishes after 4 years of experience, and then again after another 6 years.
- This federal benchmark
is compared to national inflation, while teachers’ raises are compared against
inflation in their locality, so the benchmark provides context but does not
reflect differences in federal employees’ purchasing power by locality.