This edition of State of the States focuses on key state policies related to teacher preparation in terms of state guardrails for approved programs and what teacher candidates must do to qualify for a teaching license. In a period when states have been genuinely concerned about teacher shortages, many have chosen to eliminate or compromise their policies directed at the quality of the teacher workforce, often making the expedient choice. However, not only can choosing quantity over quality cause more harm than good, it may be altogether unnecessary. States could consider alternative policy solutions that would not only address teacher shortages and expand the diversity of the workforce—two clear priorities for states—but that also would not imperil teacher quality.
Three areas rise to the top for special consideration by states, as each provides alternatives to some of the more popular but less advantageous choices states have made since 2015.
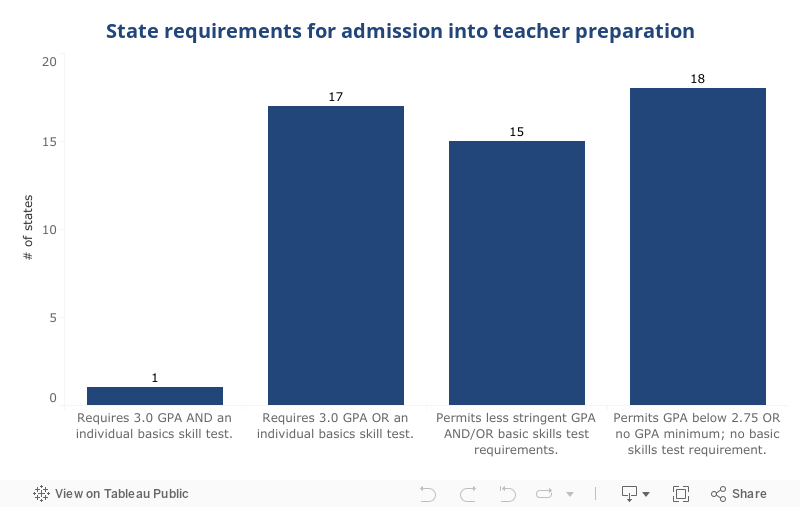
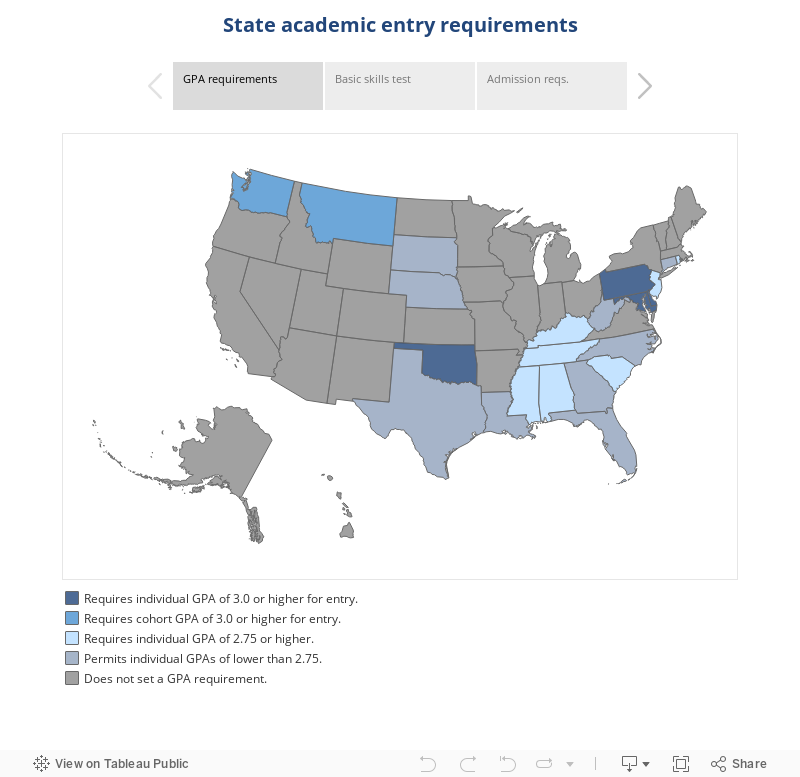
I. Raising admissions standards
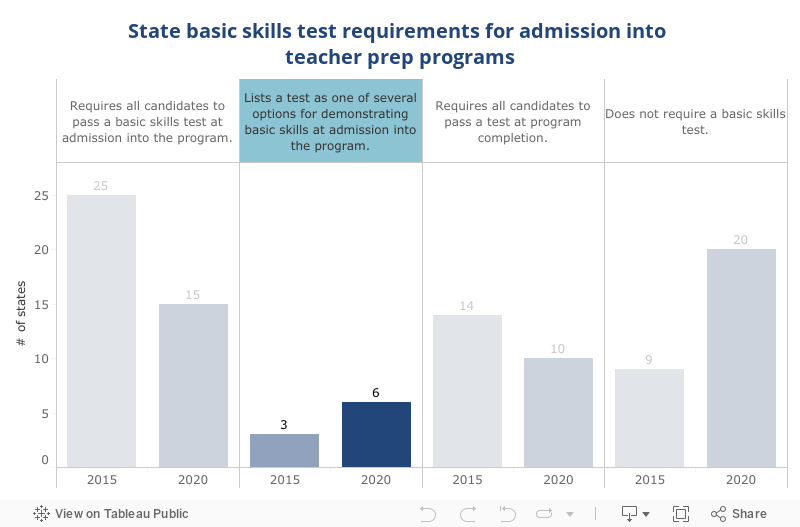
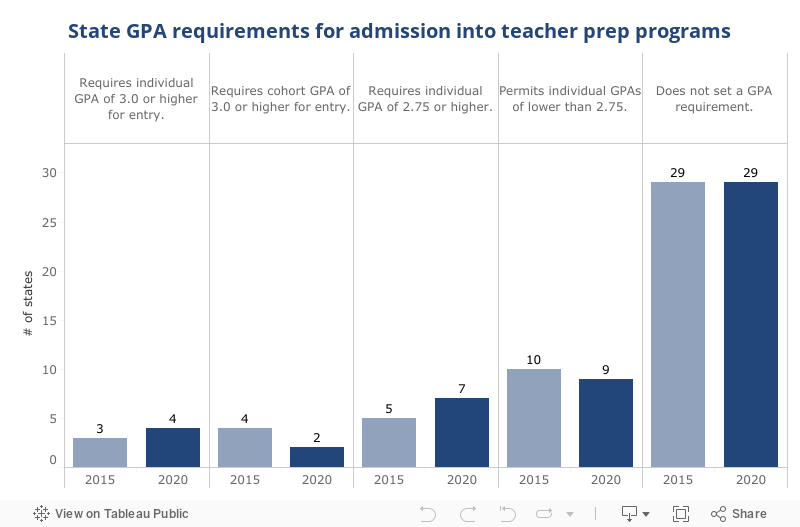
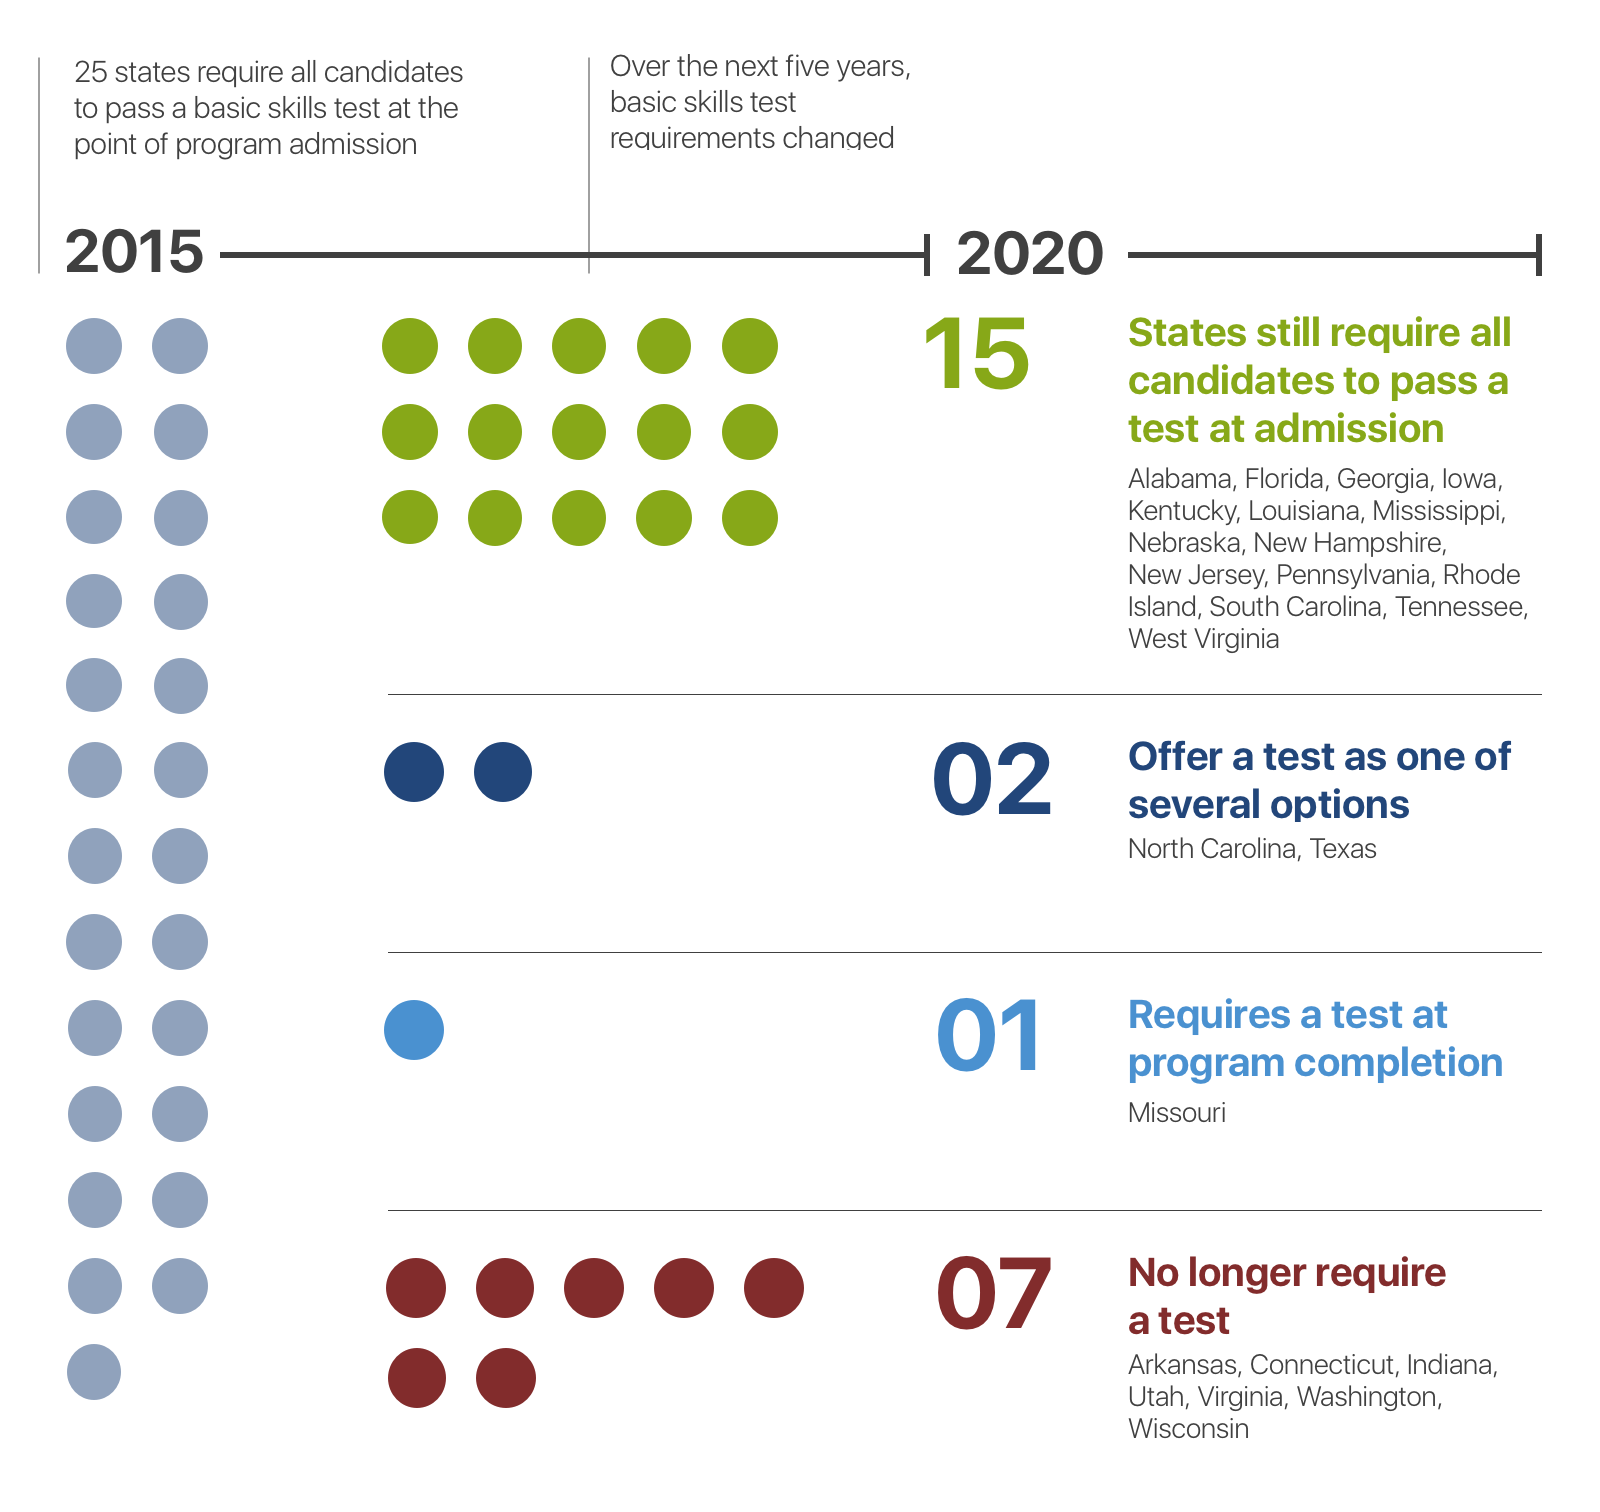
Since 2015, many states have retreated from using academic standards in the teacher preparation program admission process. A significant number of states (10 out of the 25 that had a policy in place in 2015) scaled back their requirement that applicants pass a test of their reading, writing, and mathematics skills.
While these actions were taken in response to the pressing need to diversify the profession or to ease potential teacher shortages, they may not help solve those problems. In fact, nearly 200 teacher prep programs across the country are both selective and diverse. Teacher candidates, regardless of whether they are able to pass a basic skills test for admission into a program, almost always still need to pass licensure tests administered at the end of their course of studies. How a candidate performs on a basic skills test serves as a strong predictor of performance on both content licensure tests and performance assessments.49 The same candidates who would have struggled to pass the basic skills test may have difficulty passing the content licensure test. In effect, states may be boosting the size and diversity of enrollment in teacher preparation—but not of the teaching profession itself.
Some states have instituted “proxy” measures to determine the reading, writing, and mathematics skills of teacher candidates.50 However, to our knowledge, few states have first determined whether these alternatives serve as adequate measures of a candidate’s abilities. Many of the proxies currently in use may not be capable of fulfilling the role they have been assigned.
States struggling with this issue might consider the more careful approach taken by Massachusetts, which contracted for an independent study to assess whether the state’s licensure tests do predict future teacher effectiveness (they do), and whether the tests are as predictive of how well teachers of color will perform in the classroom as white teachers (they are).51 States have an obligation to verify that their testing regimes are serving the public good, and if they are not, they should be abandoned or significantly revised. Massachusetts also launched a three-year pilot to determine whether alternative assessments to the communication and literacy skills and subject-specific Massachusetts Tests for Educator Licensure (MTELs) could serve as a reliable measure of a candidate’s future effectiveness.52 A pilot of that nature, without making a more permanent decision affecting all, will serve the interests of the state.53
II. Improving teacher knowledge of effective reading methods
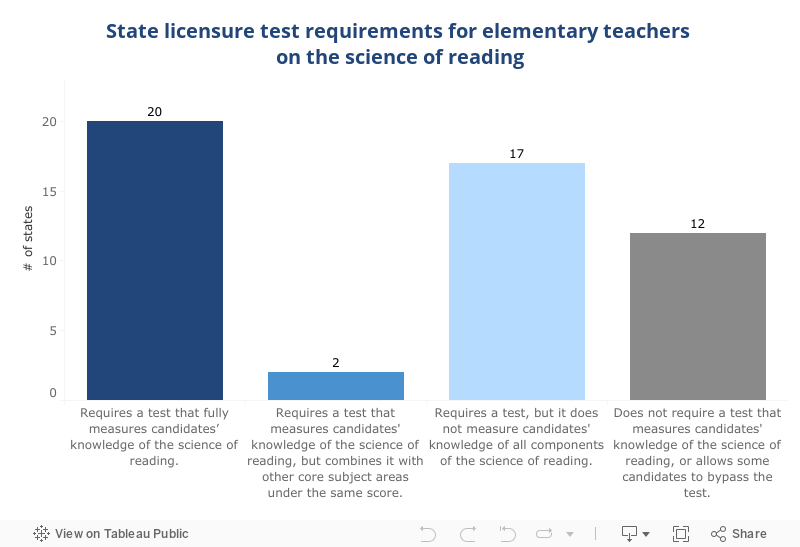
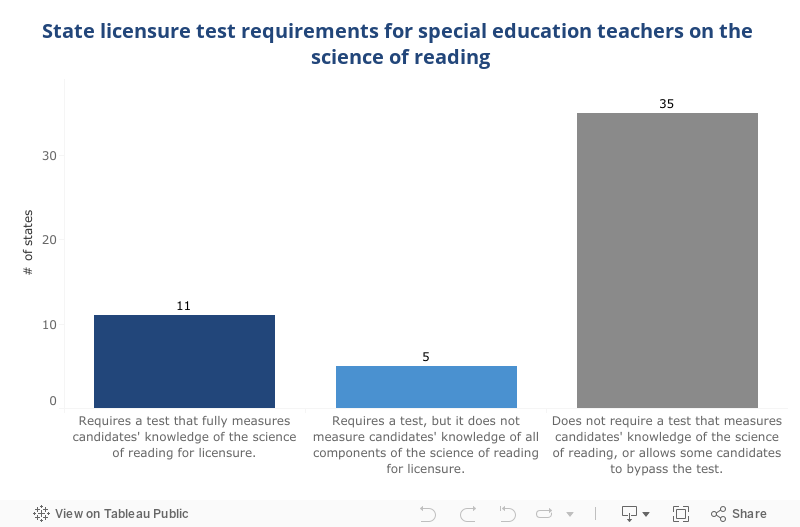
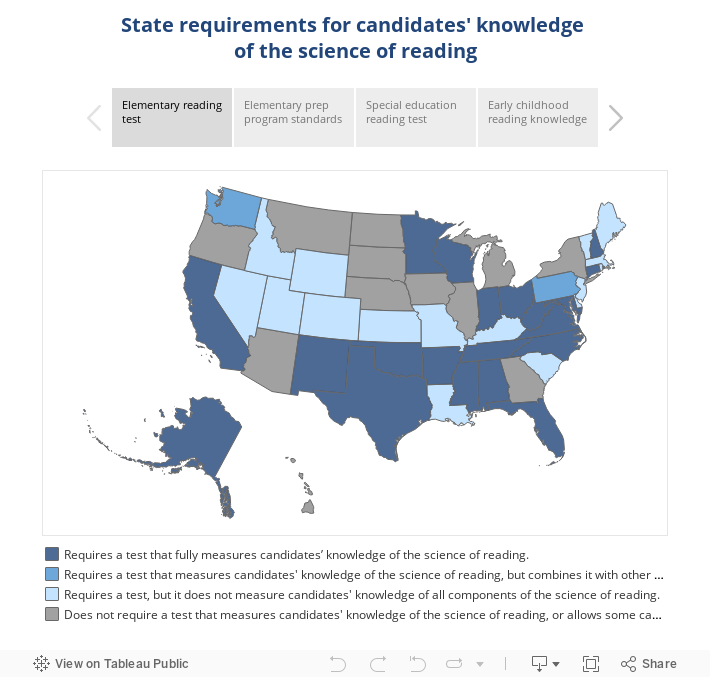
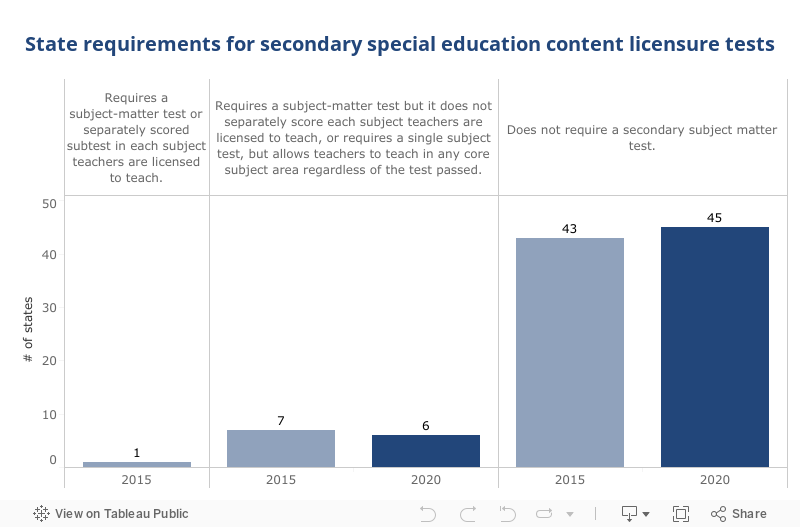
Fortunately, the need for teachers to know how to teach children to read has become a topic of urgent concern in many states. Four states (Alaska, Arkansas, Maryland, Texas) serve as bright spots with their decisions to transition to licensure tests that are more reflective of the knowledge teachers need. Twenty states currently require elementary teachers to pass what we identify as high-quality tests. Only 11 states require high-quality tests of special education teachers.
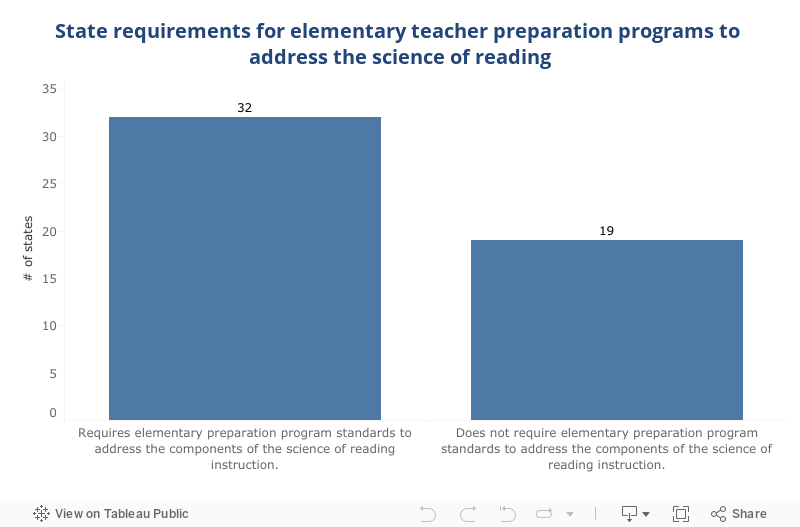
A licensure test that fully and faithfully measures knowledge of the science of reading offers the best leverage a state has regarding what their approved teacher preparation programs teach about reading instruction. However, few states use that leverage effectively—even some states that have adopted a high-quality test—because states often compromise on the minimum passing scores so that more candidates will pass, thus diluting the purpose of the assessment in the first place. For example, eight states use the Foundations of Reading test, but states’ required minimum passing scores range from 220 to 240. Some states offer candidates alternatives to having to pass the test, or they do not hold programs accountable for what is arguably the most important aspect of preparation there is—how to teach reading.
We identify four essential steps to ensure that licensure tests of reading knowledge produce the outcomes states seek:
- Select a strong, stand alone licensure test (or subtest) in reading instruction. This report lists the tests currently available to states that our review has determined are suitable as licensure tests of reading knowledge.
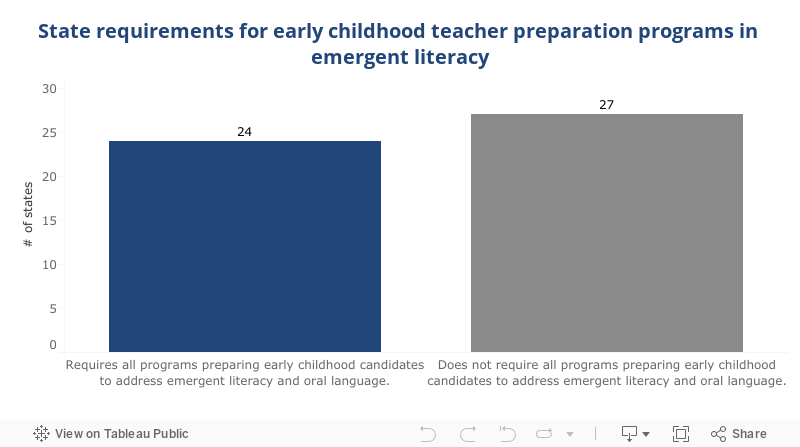
- Require a reading test of any teacher who is likely to have students who do not yet know how to read. This includes not only elementary teachers but also special education and early childhood teachers who can teach elementary grades.
- Resist lowering the recommended cut score. States often lower the recommended cut score needed to pass a test to prevent teacher shortages if unacceptably high numbers of teachers appear likely to fail. An alternative strategy would be to require teacher preparation programs to do a better job of preparing their candidates for the test. States should consider reviewing the reading courses of their programs to ensure alignment with reading science.
- The states’ strongest tool is to make first-time pass rates on licensure tests public. If programs are genuinely providing the content teacher candidates need, the pass rates on these tests will be high, and the need for multiple attempts will be minimized. This is what is being done in Florida, where both first-attempt and best-attempt pass rates on licensure exams by all test takers are published.
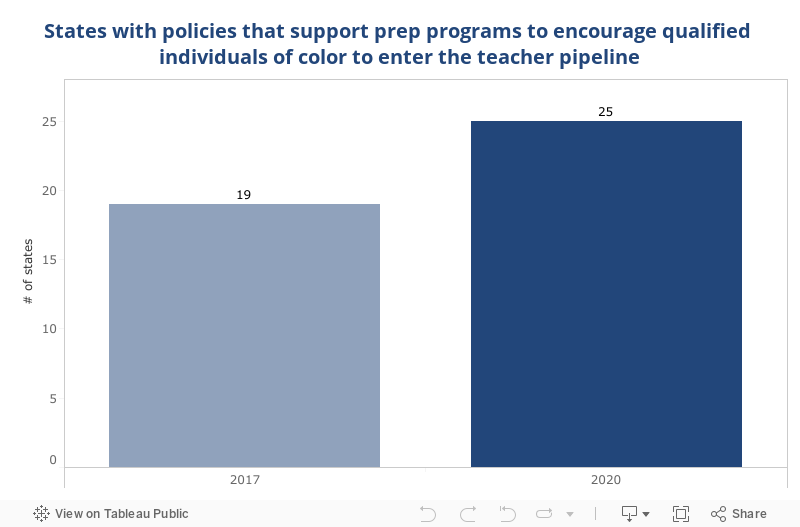
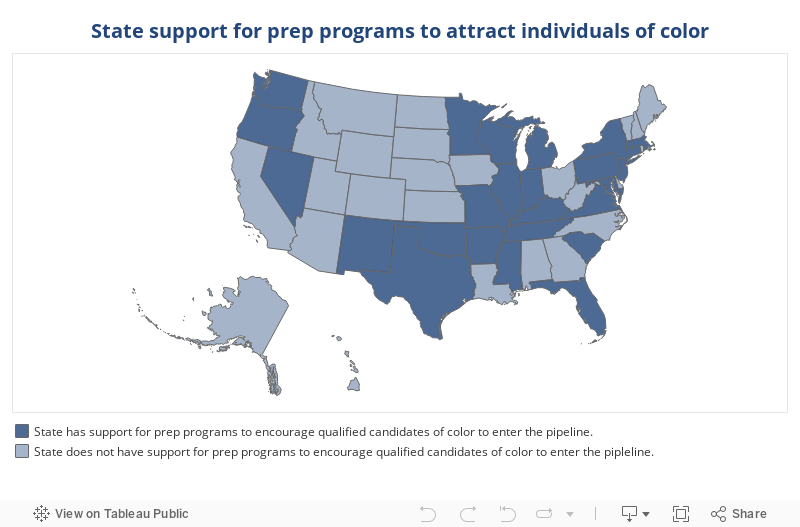
III. Diversifying the teacher workforce
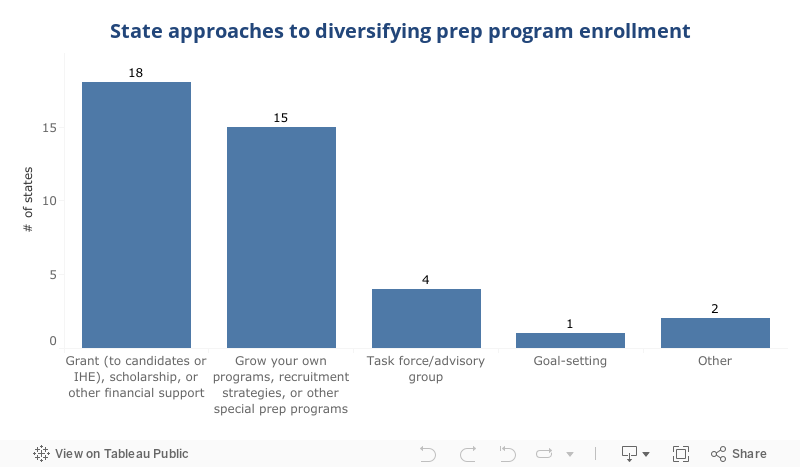
State action since 2017 is brighter on this front, with 25 states now forging policies to bring more candidates of color into the teacher pipeline. Arkansas has led the way as one of only a few states to publicly state a specific goal of increasing the diversity of the workforce by 25% by 2025. The state also requires preparation programs to provide a list of teachers of color who completed licensure programs and, with the licensees’ consent, include their contact information in a central database that is available to every public school superintendent. States are also targeting candidates early on in high school and offering funding and mentoring.
Other state actions that bear repeating include Maryland, which initiated a digital recruitment effort aimed at attracting the top 25% of high school students to diversify the teacher workforce, and New Jersey, which launched a grant program to universities that offers funding and support for aspiring teachers of color.
One of the most fruitful strategies states could deploy is to increase the number of teacher candidates of color who not only enroll in but successfully complete their program of preparation.54 A potential hurdle to program completion is licensure tests, which have recently come under fire as some candidates reach the end of their preparation program but cannot pass the test necessary to become a licensed teacher. Candidates of color are hit hardest by low passing rates on licensure tests.55
The answer is not to remove the tests, as they are the most efficient, scalable way to measure the breadth of content knowledge and other core knowledge and skills in a way that is comparable across programs. Instead, to tackle this problem, states must collect the data necessary to better understand this challenge, and then work with preparation programs to strengthen support for candidates. Low passing rates on content knowledge tests are largely driven by inequities in the K-12 education system. But with support and guidance from their state education agencies, preparation programs are in the best position to remedy this problem, not just through remediation efforts but also more explicit guidance on the coursework that aligns with what candidates will need to know and do to pass licensure tests and be effective in the classroom.
Three steps to improve enrollment and program completion rates for Black and Hispanic students:
- Set a goal to diversify the workforce, taking into consideration the current state teacher workforce and the diversity of the local adult population. Establish leading indicators disaggregated by race/ethnicity, such as program enrollment, program completion, and novice teachers within their first five years.
- Use funding to incentivize prep programs to strategically develop partnerships; recruit early; and provide financial support for candidates of color, particularly for Pell grant recipients.
- Examine licensure test first-time pass rates disaggregated by race/ethnicity to identify programs that are more successful than comparable programs in achieving positive outcomes for all groups of teacher candidates. Encourage approved programs to direct aspiring teachers toward the most optimal content coursework and to make broader use of general education requirements to fill content gaps.
In the past year, many states have had to adjust their requirements for entry into the teaching profession to accommodate the very real challenges posed by the pandemic. However, as the pandemic begins to fade, so, too, will the disruptions—but not, unfortunately, the damage done to student learning. Students will emerge from the pandemic needing teachers who are ready to make up for lost time. States can avoid compounding some of this damage through faithful adherence to the policies that can best ensure that new teachers enter the classroom thoroughly prepared to meet their students’ needs.