EXECUTIVE SUMMARY

The nation needs a strong, diverse teacher workforce to fulfill its promise of equal opportunities for all.

The quality of the teacher workforce is especially important in the early grades, when teachers bear an extraordinary responsibility, building a solid foundation for students in both the knowledge and skills they will need to succeed in later grades, as well as in their future lives.

The past year and a half has laid bare the tremendous challenges teachers face and the essential role they play in supporting students. As the pandemic abates and we reckon with the damage it wrought, we must acknowledge that recovery places unprecedented demands on our education system and its teachers.

Bringing in new teachers who are up to the task requires an understanding of the points along the pathway when we are most likely to lose teaching talent, especially those points at which aspiring teachers of color are lost to the profession.

With the release of data never before published, NCTQ focuses on a uniquely challenging point: licensure tests. An outsized number of elementary teacher candidates struggle to pass their state licensing tests, especially in the content knowledge (English language arts, mathematics, science, and social studies), defined by states as minimally necessary for the job. In many states, less than half of all test takers pass on their first try, with even lower pass rates reported for candidates of color.

45%

is the average first-attempt pass rate for states with strong testing systems.

whiteboard animation
Button play
Why Licensing Exam Pass Rates Matter
Learn how pass rate data can help strengthen and diversify the teacher workforce. (2:30)
DECONSTRUCTING COMMON MISPERCEPTIONS

Low pass rates create a challenge for policymakers and teacher preparation programs.

Low pass rates create a challenge for policymakers and educator preparation programs, fueling concerns about test bias, the relevance of the tests to classroom effectiveness, and teacher shortages. While test publishers and states must aggressively address issues of test bias, assertions about the irrelevance of the tests are largely unfounded. Licensure tests provide essential data on the quality of preparation provided by teacher preparation programs (as well as their broader institutions) and point toward successful programs from which to learn. Low pass rates have also created fertile ground for an erroneous narrative that test performance offers no insight into future teacher effectiveness, while in fact research has largely found that teachers' test performance predicts their classroom performance.

The overwhelming majority of research studies found a positive relationship between licensure tests and student outcomes.

    When faced with persistent evidence of low pass rates, some state leaders have lowered or even eliminated tests of content knowledge, despite the broad—and obvious—agreement that teachers cannot teach what they do not know. These actions are band-aid solutions that eliminate our ability to identify and fix a problem and instead shift the burden of inadequate content knowledge onto classrooms.

    The data collected over the last several years and presented here documents the pass rates achieved by institutions preparing teachers. Not only has much of it never been made public, but also, test publishers have not made many pieces readily available to the state agencies overseeing these tests or to their educator preparation programs. In fairness, publishers were not often asked to do so. The reporting requirements for pass rates under Title II of the Higher Education Act has effectively encouraged states and programs to limit their consideration of pass rates only to the "best-attempt" pass rates, that is, how many candidates pass their test regardless of how many attempts were necessary. Neither states nor programs have made public "first-attempt" pass rates (except in rare instances), even though it is common practice in other professions and serves to motivate all programs to take the tests seriously. First-time pass rates speak to the efficiency and thoroughness of programs' course of study.

    DATA-DRIVEN INSIGHTS AND OPPORTUNITIES

    Pass rates vary widely between institutions and are not wholly driven by institutional characteristics.

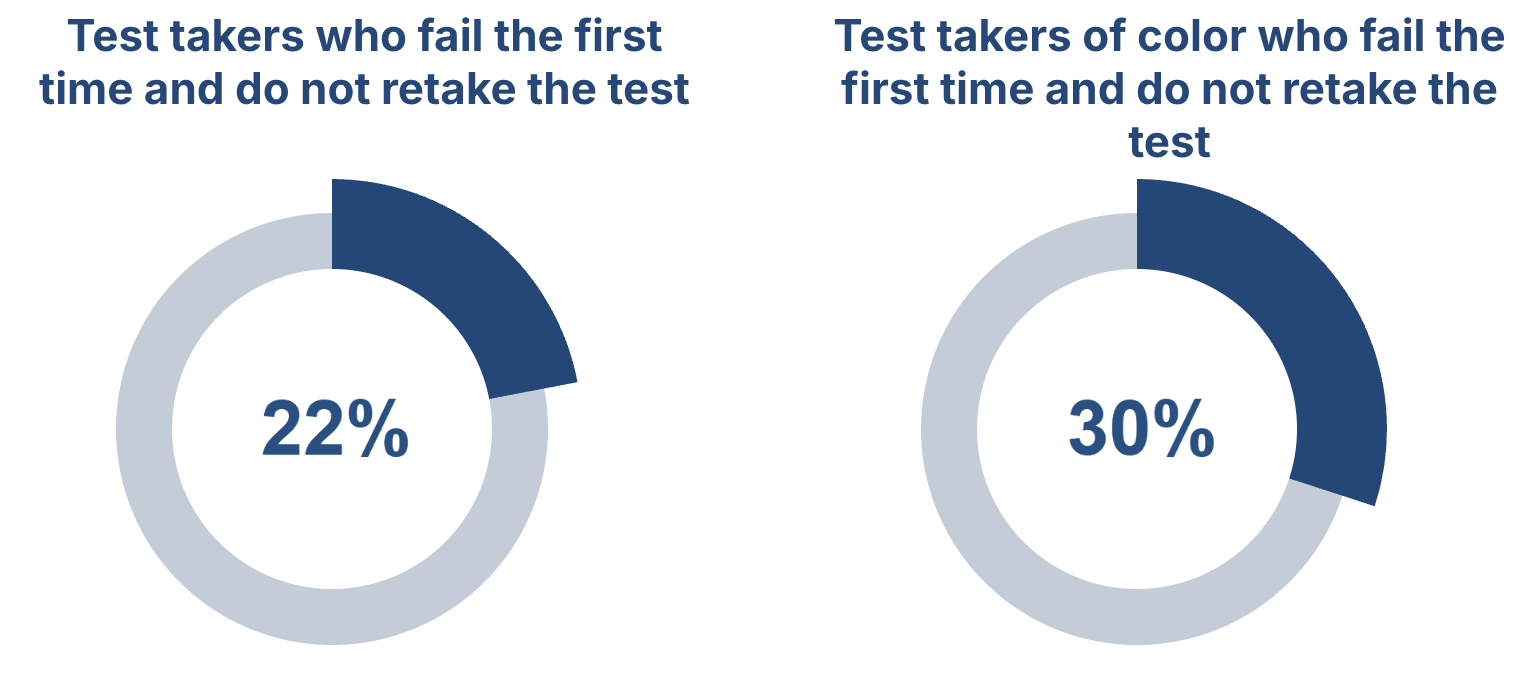
    Low first-attempt pass rates are concerning not just because multiple attempts cost candidates money, uncertainty, and delays in securing a teaching job, but because many who fail never make another attempt, an important story this new data reveals. A quarter (22%) of all test takers who fail on their first attempt do not retake the test. This number is even higher (30%) for candidates of color.

    Test takers who fail the first time and do not retake the test
    Test takers of color who fail the first time and do not retake the test

    The most important revelation emerging from this new data may not be the remarkable variation among institutional pass rates in the same state (there's an average 56 percentage point gap between the highest and lowest institutions in a state on candidates' first attempt). Instead, it is the fact that neither the backgrounds of the candidates nor institutional characteristics fully explain the variances. For that reason, the data presented here provides a means of identifying higher-performing institutions among those with lower admissions selectivity or with more Pell grant recipients. A more likely explanation for these stronger performing programs is the quality of preparation, including both the support provided and the degree to which coursework is aligned with the content.

    There are startling differences in pass rates among institutions within the same state. On average, there is a 56 percentage point gap between the highest and lowest performing institutions.

    This first release of pass rate data offers an objective lens on teacher preparation.

    The data presented in this first release, with more to follow in subsequent releases, inserts much-needed objective information on the performance of teacher preparation programs, while also accommodating issues of institutional and state context. It is the absence of context that allowed states to overlook pass rate data when renewing approval of programs or even including such data on report cards of teacher preparation programs. Without this data, teacher preparation programs have been able to attribute chronically low pass rates to factors beyond their control, instead of following the steps of more successful peer institutions and directing aspiring teachers toward courses covering the content knowledge needed to teach elementary grades.

    Info icon
    See the new teacher licensure pass rate data on the State Dashboards.
    Explore state data.

    Even with the advancements this data represents, there are significant problems to be solved. The data reported here presents the pass rates for the institution, not specific programs within the institution, which would be a more meaningful and actionable indicator. Another problem is the use of licensing tests by some states that make it possible for candidates' strength in one subject to compensate for weakness in another. Further is the practice by some states to set the cut score below what has been formally recommended. Not surprisingly, states that use relatively easy tests or set lower passing scores report higher pass rates. The underlying problem—a less well-prepared workforce—is not skirted but is shifted to the elementary classroom where teachers struggle to teach what they do not adequately know.

    A PATH FORWARD

    Institutional pass rates at a much greater level of detail are now available for the first time.

    Publishing this abundant data for each state in a customized dashboard provides a watershed moment to explore test outcomes within each state, opening a window into how different institutions perform under the same state expectations, regardless of the rigor of those expectations. Most significantly, they identify stronger programs as models for others and provide a much-needed system to spur continuous improvement. While no single measure of institutional performance tells the full story, considering this data through a range of lenses yields important insights that can be paired with other available data, forming the basis for more intensive exploration. Publishing this data and building out the data system to support it are crucial steps in states' efforts to better identify where their greatest needs and challenges lay in building a strong, diverse teacher workforce.

    CASE STUDIES

    Standout States

    Florida: Credible data demonstrates the value of teacher prep

    Florida's steadfast push for transparency has helped it raise the bar for teacher quality.

    Illinois: Building buy-in while building a data system

    Illinois has gone from simple spreadsheets to a sophisticated report card system to promote preparation program improvement.

    Massachusetts: Putting everything to the test

    Massachusetts has leveraged its strong data system to ask hard questions about what's working in the state and to pinpoint opportunities to strengthen its teacher pipeline.

    Texas: Measuring what matters

    Texas has developed an exemplary set of data dashboards, supporting its efforts to build a strong, diverse teacher workforce.

    Standout Institutions

    Test takers of color earn high pass rates: Western Kentucky University

    At Western Kentucky University, test takers of color show that they can excel compared with aspiring teachers across the state.

    Greater socioeconomic diversity and high pass rates: Texas A&M International University

    Texas A&M International University proves that with less selective admissions standards and greater socioeconomic diversity, the institution can exceed the state's average for first-time pass rates.

    Lower admissions selectivity and high pass rates: Western Connecticut State University

    Western Connecticut State University illustrates that institutions don't have to be among the elite to achieve excellence.

    APPENDICES

    A

    The data components provided by states

    B

    Literature review on licensure test predictive validity

    C

    Examining states' testing systems

    D

    Non-program test takers in licensure test data

    E

    Technical notes & instructions on using data spreadsheet

    Acknowledgments
    NCTQ President

    Kate Walsh

    Project Leads

    Hannah Putman & Ashley Kincaid

    NCTQ Staff

    Amber Moorer, Andrea Browne Taylor, Christie Ellis, Clyde Reese, Danielle Wilcox, Jamie Ekatomatis, Kelli Lakis, Ken Wagner, Laura Pomerance, Lisa Staresina, Nicole Gerber, Ruth Oyeyemi, Shannon Bradford, Shannon Holston, Shayna Levitan, and Tirza Buelto

    Funders
    • Alice Walton through the Walton Family Foundation

    • Bill and Melinda Gates Foundation

    • Sid W. Richardson Foundation

    • Barr Foundation

    • Gates Family Foundation

    Content Matters Advisory Committee

    Dawn Basinger, Louisiana Tech University; Mary Bivens, Colorado Department of Education; Anika Burtin, University of the District of Columbia; Abigail Cohen, Data Quality Campaign; James Cibulka, Consultant/Former President, Council for the Accreditation of Educator Preparation; Edward Crowe, TPI-US; Eric Duncan, The Education Trust; Deb Eldridge, Western Governors University; Cheryl Ensley, Grambling State University; Emily Fox, Illinois State Board of Education; Edith Gummer, Arizona State University; Simone Hardeman-Jones, GreenLight Twin Cities; Jerri Haynes, Tennessee State University; Tanji Reed Marshall, The Education Trust; Tiffany McDole, Education Commission of the States; Jessica McLoughlin, Texas Education Agency; Daniel Moore, Florida Department of Education; Daniel Robinson, University of Texas at Arlington; Deborah Scheffel, Colorado Christian University; Evan Stone, Educators for Excellence

    Additional guidance and input

    Ryan Franklin, Kelvey Oeser, and Mark Olofson, Texas Education Agency; Elizabeth Ross and Joelle Lastica Hlava, Office of the State Superintendent of Education, Washington, DC; Massachusetts Department of Elementary and Secondary Education; Florida Department of Education; Nermin Zubaca, Delaware Department of Education; Emily Fox and Jason Helfer, Illinois State Board of Education; Dan Goldhaber, Center for Analysis of Longitudinal Data in Education Research & University of Washington, Meagan Comb, Boston University Wheelock Educational Policy Center

    Design and Technical Development
    • Katy Hinz, Katrina Keane, Teal Media

    • Jeff Hale, EFA Solutions

    Legal Expertise

    Teri Peeples (formerly of Sidley Austin LLP), Tanisha Singh, and Symone Yancey, Sidley Austin LLP

    Recommended citation for report

    Putman, H. & Walsh, K. (2021). Driven by Data: Using Licensure Tests to Build a Strong, Diverse Teacher Workforce. Washington, D.C.: National Council on Teacher Quality.

    Recommended citation for state dashboards

    NCTQ. (2021). [STATE] Licensure test data: Learning from institutional pass rates on elementary content teacher licensure tests. Washington, D.C.: National Council on Teacher Quality.

    The findings and conclusions contained within are those of the authors and do not necessarily reflect positions or policies of any funders, project advisors, or other entities.

    Symbol

    Get More Updates On Our Research