Skip to Content
Research & Insights Teacher Licensure Test Pass Rates

Digging Deeper: Which types of institutions achieve excellence and equity for aspiring teachers of color?

JULY 2022

Cite Share
INTRODUCTION

Building a more diverse teacher workforce is essential to addressing educational inequity for students of color.

Educational inequity—both the opportunities available and outcomes produced—for students of color has long been one of the most persistent and troubling issues in education. The pandemic has exacerbated this divide, its harsh toll on students of color particularly alarming. This moment brings new urgency to the need to not only address the pandemic’s educational impact, but also the educational inequities that long preceded the virus. One of these is inequitable access to a diverse, effective teacher workforce.

While there is no panacea, a long-standing priority in education has become even more essential: building a more diverse teacher workforce. Compelling and ample evidence demonstrates that students of color benefit in both the short term (such as through fewer absences and suspensions, and higher academic achievement) and in the longer term (such as through greater high school graduation and college matriculation rates) when they have a same-race teacher. While much of the research has coalesced around Black students and teachers, a new study finds similarly positive outcomes for Hispanic student-teacher matches. The impact is particularly great for students in the elementary grades. Further, all students benefit from access to a diverse teacher workforce over the course of their years in school.

While the teacher workforce has become more racially diverse over the years, it has not kept pace with the far more rapidly diversifying student population. Bringing more teachers of color into the classroom is a priority, yet remains a challenging goal to achieve. Aspiring teachers of color are lost at disproportionately higher rates at all points in the pathway into the classroom. Equally important is providing conditions in schools that retain teachers once in the classroom, although this report will only focus on the recruitment and pipeline.

Licensure tests are one point in the pathway into the classroom that have received a great deal of scrutiny. The field agrees that teachers cannot teach what they do not know, and while licensure tests are not the only way to measure that knowledge, they offer some important advantages over the alternatives: they are efficient, reliable, scalable, and comprehensive. Further, while it may not be possible to fully remove bias from any assessment, standardized licensure tests typically undergo a rigorous process to identify and remove or mitigate bias in the assessment, although states should inquire about this process whenever considering a new test (for more, see the FAQs below).

Licensure tests are an efficient, reliable, scalable, and comprehensive measure of teachers’ content knowledge.

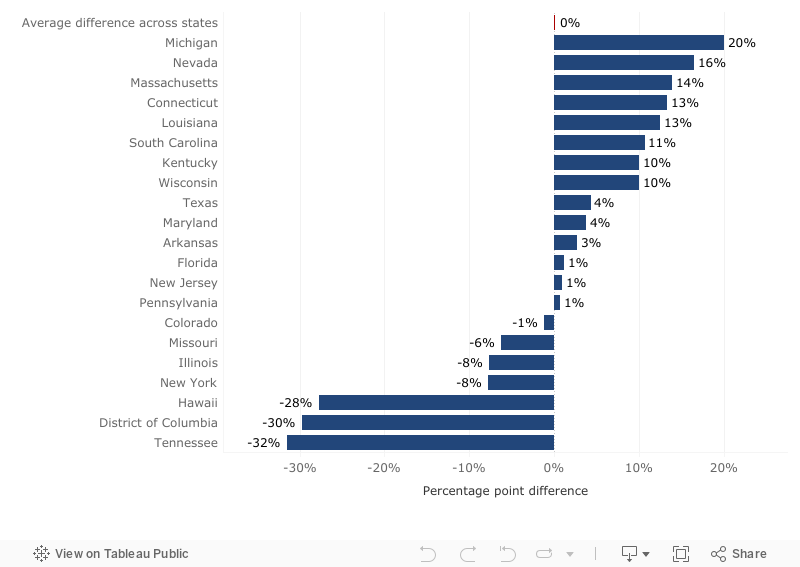
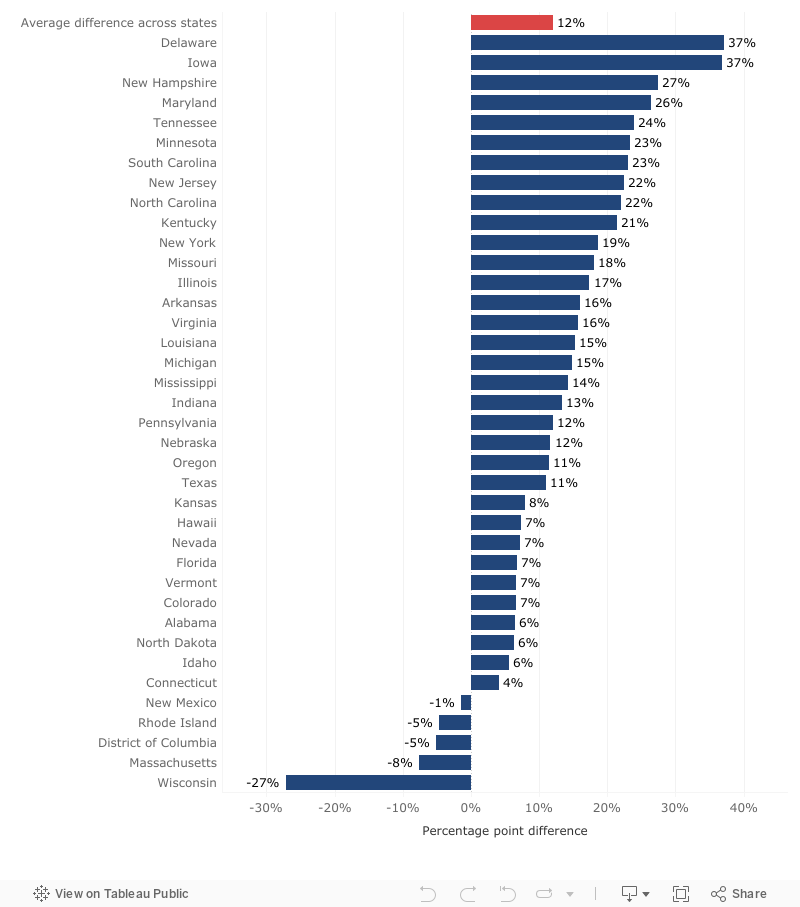
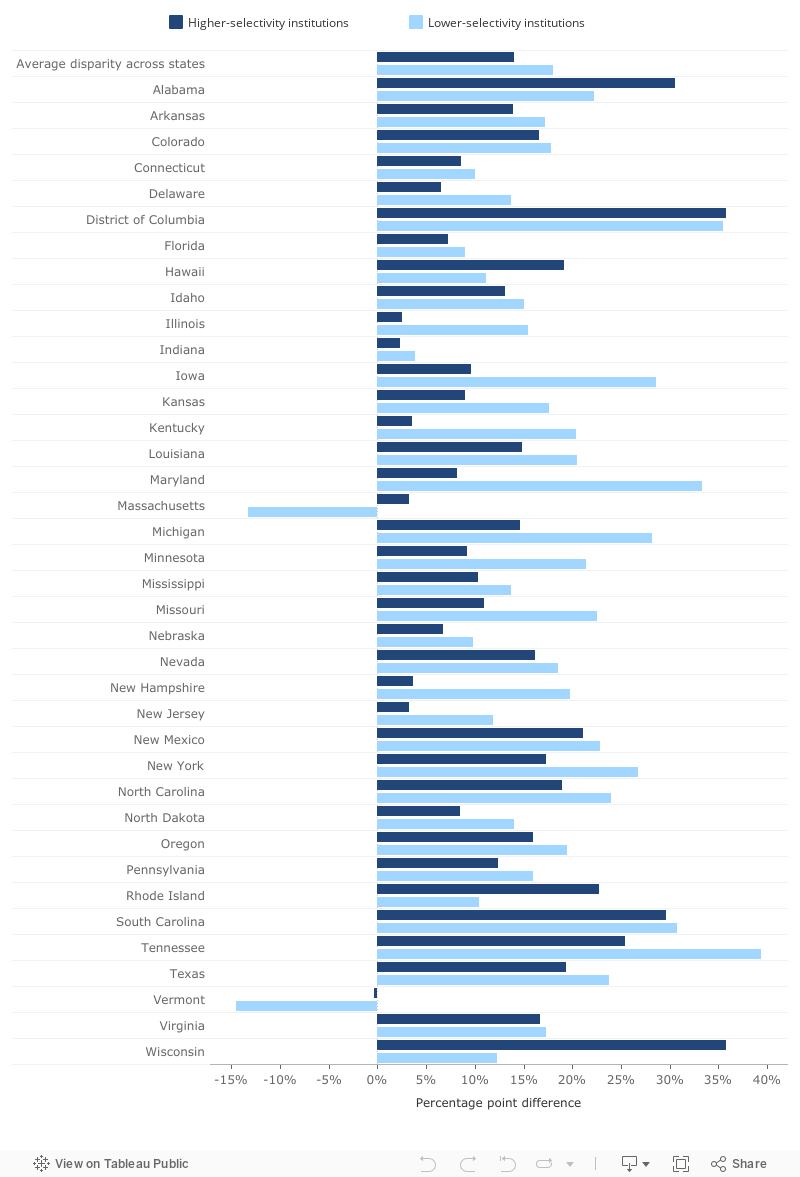
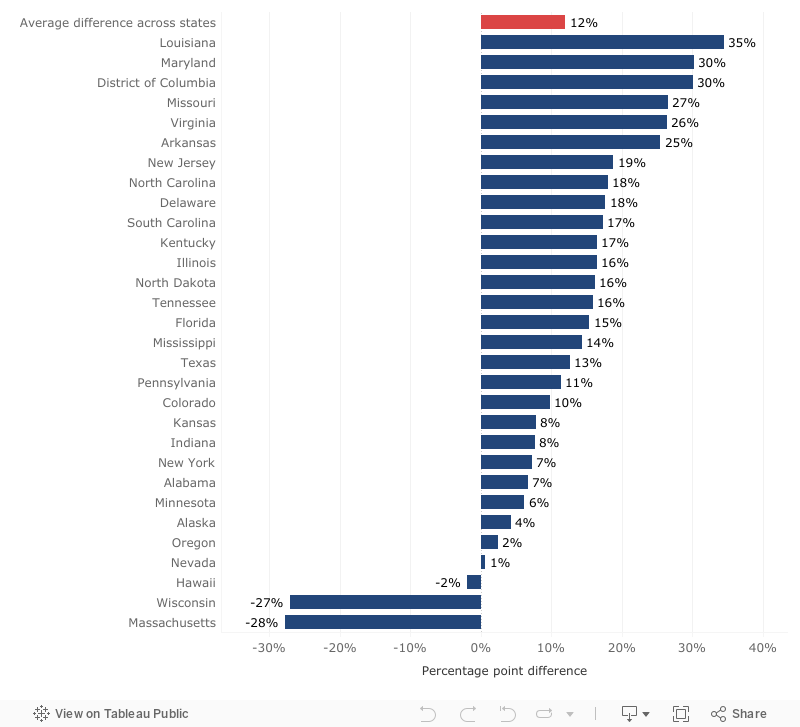
These tests intend to set guardrails for entry into the profession, ensuring that anyone entrusted to teach children has demonstrated an adequate understanding of the content that they will be expected to teach. Moreover, most research finds that content licensure tests predict teacher effectiveness. Historically, institutions have been less successful in preparing aspiring teachers of color to pass these exams, hindering their efforts to become licensed teachers. It is important to note that while institutions of higher education and the teacher preparation programs within them are best positioned to address low and disparate pass rates on licensure tests for their aspiring teachers, the problem does not necessarily start with teacher prep programs. Much of this content comprises material that high schools should have taught all students, including aspiring teachers. Content licensure tests for aspiring elementary teachers generally address the subjects taught by elementary teachers, including English language arts (especially children’s literature), science, social studies, and mathematics.


Unfortunately, the system often fails aspiring teachers of color long before they enter a teacher preparation program.

Numerous studies show that students of color have less access to effective teachers, and the inequities in their K-12 education experience are manifest in lower test scores on the National Assessment of Educational Progress (NAEP), licensure tests, and other outcome measures. It then falls to institutions of higher education to build upon students’ knowledge of the content through general education course requirements, and to teacher preparation programs to act as a final check, ensuring that aspiring teachers take courses aligned to the content they’ll be teaching before they take licensure tests and enter the classroom.

Without this important guardrail, we allow teachers into the classroom without verifying they have the fundamental content knowledge necessary to help their students succeed. Then, as historical data shows, students of color and students living in poverty are most likely to be assigned inexperienced, less effective, and out of field teachers. It is these students who stand to lose the most if states stop verifying teachers’ content knowledge, as they will almost inevitably be assigned to novice teachers who may or may not know the content the students need to learn—repeating the vicious cycle of systemic inequity.

One step to provide greater opportunities to students of color and, indeed, to all students, is to increase the number of aspiring teachers of color who reach the classroom by equipping them with the skills and knowledge to meet the demands of the profession. Meeting this goal is essential to building a stronger, more diverse teacher workforce that can help students recover from missed learning.

This report explores:

  • Which institutions achieve excellence for aspiring teachers of color, with pass rates for test takers of color that exceed the state average for all test takers?
  • Which institutions achieve equity, with little or no disparity in pass rates for test takers of color compared with white test takers?
  • At which types of institutions do aspiring teachers of color tend to be more successful?

Licensure tests, a key measure of this knowledge, are often accused of keeping aspiring teachers of color out of the classroom. On elementary content licensure tests, NCTQ’s analysis found an average 16 percentage point gap in first-time pass rates for test takers of color compared with white test takers. This gap shines a harsh light on the consequences of systemic racial inequities in K-12 education, demonstrating that many aspiring teachers of color have not been given the opportunities to learn core content that they will need to be able to teach their students.

The goal of this project is to draw attention to where we need to shore up preparation for aspiring teachers so that every elementary student is taught by a diverse set of teachers with a strong foundation in the core subjects they teach.

This report, a continuation of the Driven by Data project, explores elementary content teacher licensure tests, focusing on first-attempt pass rates at the institution level across 700 institutions in 43 states. In these states, there are about 201,700 total test takers over three years of data, with more than a quarter (27%) identifying as persons of color. Using this rich dataset, we identify institutions supporting aspiring teachers of color on their path into the classroom and unearth surprising trends about the types of institutions where aspiring teachers of color tend to be more successful.

This report considers the data through two lenses: excellence and racial equity. At which types of institutions are test takers of color achieving greater success on licensure tests compared to the average pass rate for all test takers across the state, and at which types of institutions is there little or no disparity in pass rates between aspiring teachers of color and white aspiring teachers?

The goal of this report is to highlight those institutions that achieve racial equity, pointing toward promising practices that others can adopt and proving that high pass rates for aspiring teachers of color are entirely achievable.

Policy discussions that might generate a set of practical, effective solutions to the status quo have been limited due to the near absence of data that would allow the public to examine pass rates in-depth and how they vary among individual institutions in a state. Eliminating licensing exams is a band-aid solution that limits our ability to identify and fix the problem: lack of teacher content knowledge. It just shifts the consequences onto students and perpetuates existing inequities.

This report begins this exploration, but the most important work must occur within each state and teacher preparation program, examining its own data, practices, policies, and outcomes.

What the data shows

Institutions can play a substantial role in how well aspiring teachers will perform on licensing tests. More than 80 institutions achieve both equity and excellence, with little or no disparity in pass rates for test takers of color, and pass rates for test takers of color that exceed the state average for all test takers.

See Equitable and Excellent institutions by state

NCTQ identified 89 institutions that exhibit equity and excellence in pass rates for aspiring teachers of color.

Equity: There is little or no disparity in pass rates between aspiring teachers of color and white aspiring teachers at the institution.

Excellence: Test takers of color at the institution achieve greater success on licensure tests compared to the average pass rate for all test takers across the state.

See the full list here.

While the national rate of test takers of color who pass is markedly lower than for their white peers (about 16 percentage points lower), this substantial segment of institutions provides strong evidence that more equitable outcomes are achievable.

The type of institution that is preparing future elementary teachers appears to matter.

  • Public institutions seem to have slightly better outcomes than private institutions. Not only do public institutions post a marginally higher percentage of their test takers of color passing than at private institutions, but the disparity in pass rates between test takers of color and white test takers also appears to be smaller at public institutions.
  • Alternate route programs (not housed in traditional institutions of higher education), while more diverse than traditional institutions, also have the greatest disparities in pass rates between test takers of color and white test takers, with white test takers passing at far greater rates than test takers of color at those programs. However, on average across states, test takers of color pass at similar rates whether they attend an alternate route program or a traditional institution.
  • At more selective institutions (based on admission into the institution and into the undergraduate elementary preparation program at that institution), test takers of color pass at higher rates than those at less selective institutions, and more selective institutions have a lower disparity in pass rates between white test takers and test takers of color. However, importantly, there are 20 institutions with lower selectivity that have no disparity and above-average pass rates for aspiring teachers of color.
  • At the institutions with the most overall test takers in each state, test takers of color earn higher pass rates than at the institutions with the fewest test takers. Institutions with more test takers also have a smaller disparity in pass rates between white test takers and test takers of color.
  • At minority serving institutions, test takers of color pass at much lower rates than those at non-minority serving institutions. This trend holds true even when comparing among only more selective institutions or only less selective institutions.
  • Efforts to build a more diverse teacher workforce prepared to positively impact students will benefit considerably from efforts to support aspiring teachers of color in passing their licensure tests. Across this three-year time period, 14,000 test takers of color out of nearly 55,000 did not pass their licensure test or subtest, even after multiple attempts, and so likely never made it into the classroom.
LEARN MORE


FAQs on teacher licensure tests

  • SECTION 1

    Institutions achieving equity and excellence

    Across the roughly 640 institutions that reported pass rates for both white test takers and test takers of color, 89 institutions (14%) report little or no disparity in first-attempt pass rates between these two groups, and their pass rates for test takers of color exceed the state average for all test takers. Another 67 institutions report little or no disparity in pass rates between these groups, although their pass rates for aspiring teachers of color fall below the state average.

    These 89 institutions that exhibit both equity and excellence do not fit into any single pattern or category:

    • They are a mix of public (45 institutions) and private institutions (38 institutions), with a handful of non-institution-based alternate route programs (six programs). This skews somewhat more heavily toward public institutions than the full set of institutions in the data sample.
    • About a quarter are among those institutions with the most test takers in their states (20 institutions). None are small (the institutions in each state with the fewest test takers). The rest of the institutions (69 institutions) fall in the middle for number of test takers.
    • About a quarter of institutions are more socioeconomically diverse, with more Pell grant recipients than the national average (18 institutions).
    • While most are more selective (62 institutions are considered selective or very selective), not all are (20 are moderately selective, less selective, or not selective, and seven could not be evaluated on their selectivity).
    • Two are Minority Serving Institutions.

    Figure 1.

    States where institutions support aspiring teachers of color in achieving equity and excellence

    Hover over states for detail.

    More than half of states are home to at least one institution where aspiring teachers of color achieve equity and excellence on licensure tests. These institutions may offer promising practices that can be replicated more broadly. View a list of which institutions have little or no disparity in pass rates and help test takers of color achieve pass rates above the state average for all test takers.

    Note: N=43 states that provided institution-level pass rate data for test takers of color. The map only includes institutions or non-institution based alternate route programs that have sufficient white test takers and test takers of color to report pass rates in each state (generally at least five test takers in each group, although this number varies by state).

    Spotlight: ‘Equitable and Excellent’ institutions

     
    Three of these ‘Equitable and Excellent’ institutions share the steps that they take to help all of their test takers, and especially test takers of color, achieve success on licensure tests and beyond.
  • Why does it matter whether aspiring teachers pass their test on their first attempt?

    While all states allow test takers to take their licensure tests multiple times, the “first-attempt” pass rate serves as an important indicator. A high first-attempt pass rate may reflect thorough and efficient preparation on the part of the institution. Having to take a test multiple times because of poor preparation comes with high costs for the candidate: additional time to study, money to pay to take the test again or to spend on test-prep, delays in earning a teaching license.

    Approximately one in five people who fail on their first attempt do not retake the test. Nationally, this rate rises to nearly one in three for test takers of color, more evidence of systemic inequities in education that can be traced back well before post-secondary education.

    SECTION 2

    Pass rates by institution type


    Public versus private institutions

    When considering pass rates for all test takers, public and private institutions perform about the same (in fact, there is only an average one percentage point difference in pass rates across states). However, public institutions see slightly greater success in pass rates for aspiring teachers of color. Public institutions also report a smaller disparity in pass rates between test takers of color and white test takers, compared with private institutions.

    Figure 2.

    Difference in pass rates for test takers of color, public vs. private institutions

    A positive value indicates higher pass rates at public institutions. Hover over bars for detail.

    For test takers of color, public institutions report slightly higher pass rates (by an average of two percentage points) compared to private institutions.

    Note: N=37 states for which pass rates for test takers of color were available at both public and private institutions.

    Figure 3.

    Disparity in pass rates between test takers of color and white test takers, public vs. private institutions

    A positive value indicates that white test takers perform better than test takers of color.
    Hover over bars for detail.

    Public institutions see lower disparities in pass rates between white test takers and test takers of color (14 percentage points vs 17 percentage points).

    Note: * Indicates that the state has disparity data available for one type of institution but not the other.

    For many aspiring teachers, failing a licensure test on their first attempt can be discouraging. Taking the test again costs time and money, and some test takers do not retake the test. Walk-away rates, or the proportion of test takers who fail on their first attempt and do not retake the test in the three-year window, are higher for test takers of color (by about 10 percentage points across states). Supporting more aspiring teachers of color to succeed on the first try is a clear opportunity to address a point in the on-ramp to the classroom where we are losing too many future teachers of color.

    While there is tremendous variation among institutions within states, looking at some broader trends is informative. For example, while on average across states, walk-away rates are only two percentage points higher for public institutions than private institutions, some states see greater variation. In Arkansas, Connecticut, the District of Columbia, Hawaii, and Nebraska, walk-away rates for test takers of color at public institutions are far higher than for test takers of color at private institutions in those states.

    Figure 4.

    Walk-away rates for test takers of color, public vs. private institutions

    Hover over bars for detail.

    On average, walk-away rates for test takers of color across public and private institutions are very similar (31% for public institutions and 29% for private institutions), although this average masks substantial variation between states. Alternate route programs tend to have higher walk-away rates, averaging 39%.

    Note: N=22 states. Not all states were able to provide the data needed to calculate walk-away rates, and so some states are omitted from this graph.

    Alternate route programs


    Alternate route (alt-route) programs tend to be much more diverse than other institutions. On average, test takers of color comprise about 51% of all test takers for alt-route programs, compared to only 21% of test takers at institutions of higher education. Still, alt-route programs account for only a small portion of test takers (8% of all test takers, and 14% of test takers of color across these states).

    Figure 5.

    Difference in pass rates for test takers of color, traditional institutions vs. alternate-route programs

    A positive value indicates that test takers of color perform better at traditional institutions.
    Hover over bars for detail.

    Averaged across states, there is no difference between pass rates for test takers of color at traditional institutions of higher education and those in alternate-route programs, but this average masks tremendous variation among states.

    Note: N=21 states. Not all states provided data on alt-route programs, and some states had too few test takers to report pass rates separately for white test takers and test takers of color.

    While more diverse than institutions of higher education, alt-route programs actually see less equity in pass rates. Alt-route programs report a greater disparity in pass rates between white test takers and test takers of color (alt-route programs have a 30 percentage point disparity in pass rates between white test takers and test takers of color) than do institutions (a disparity of 20 percentage points).

    Implications: Some alt-route programs require taking content licensure tests as a condition for admission into the program and many alt-route programs do not include content-specific coursework and so may not consider aspiring teachers’ preparation in content to be part of their responsibility. However, these findings raise some potential opportunities for alt-route programs. Given the greater diversity of their applicants and the inequity in pass rates, alt-route programs should consider taking the extra step of identifying their applicant pool and providing some additional support in preparing for licensure tests (e.g., offering diagnostic testing, test prep, or resources to teach content in applicants’ areas of weakness).

    SECTION 3

    Pass rates by institution characteristics


    Institutional selectivity

    Over one-third of aspiring teachers of color in this sample are enrolled at more selective institutions (36% of test takers of color). In general across all test takers, test takers at more selective institutions tend to earn higher pass rates than those at less selective institutions (by an average difference of 11 percentage points across states). This difference is slightly greater for test takers of color. More selective institutions also report less of a disparity in pass rates between white test takers and test takers of color.

    Figure 6.

    Difference in pass rates for test takers of color, higher-selectivity vs. lower-selectivity institutions

    A positive value indicates higher pass rates for test takers in more selective institutions.
    Hover over bars for detail.

    Test takers of color at more selective institutions earn pass rates 12 points higher than test takers of color at less selective institutions (averaged across states); the gap in pass rates for white test takers between higher- and lower-selectivity institutions is only 9 points in these same states.

    Note: N=38 states. Five states had too few test takers of color in either higher- or lower-selectivity institutions to report pass rates, and so are omitted from this graph.

    Figure 7.

    Disparity between pass rates for white test takers and test takers of color, by institutional selectivity

    A positive value indicates higher pass rates for white test takers. Hover over bars for detail.

    More selective institutions achieve slightly greater equity: the gap between pass rates for test takers of color and white test takers at selective institutions is 14 points, vs. 18 points at less selective institutions (averaging across states).

    Note: N=38 states. Five states had too few test takers of color in either higher- or lower-selectivity institutions to report pass rates, and so are omitted from this graph.

    At more selective institutions, test takers of color also tend to have lower walk-away rates (by five percentage points) compared with walk-away rates at institutions with lower selectivity.

    While less selective institutions as a whole do not perform as well, 20 institutions with lower admissions selectivity stand out: they have little or no disparity in pass rates for test takers of color and their test takers of color pass at a rate higher than the state average for all test takers. View a list of these standout institutions.

    Implications: Interpreting these results is complicated. These stronger outcomes for test takers of color at more selective institutions may reflect that these institutions are better supporting aspiring teachers of color. Or, it could instead be a reflection that the students accepted into these institutions have had access to greater opportunities than students at some of the less selective institutions. However, the institutions with lower selectivity and greater equity and excellence proves that better outcomes are entirely possible.

    Minority serving institutions

    Nearly one-quarter of test takers of color (23%) in this sample attended Minority Serving Institutions (MSIs). These MSIs included almost as many white test takers as test takers of color (11,500 white test takers compared to 12,500 test takers of color).

    Figure 8.

    Difference in pass rates for test takers of color, non-Minority Serving Institutions vs. MSIs

    A positive value indicates test takers of color earn higher pass rates at non-MSIs. Hover over bars for detail.

    Based on first-attempt pass rates, test takers of color tend to pass their elementary content licensure tests at higher rates at non-MSIs rather than at MSIs, an average difference of 12 percentage points. In only three states, Hawaii, Massachusetts, and Wisconsin, do test takers of color earn higher pass rates at MSIs rather than at non-MSIs.

    Note: N=30 states. In 12 states, there were either too few test takers of color enrolled at Minority Serving Institutions or there were no Minority Serving Institutions reporting pass rates; and in one state, there were too few test takers of color at non-Minority Serving Institutions. These 13 states are omitted from the graph above.

    For best-attempt pass rates, this gap closes, but not by much. Test takers of color at non-MSIs outperform those at MSIs by about eight percentage points. MSIs see higher best-attempt pass rates for test takers of color in six states: Delaware, Illinois, Massachusetts, Nevada, North Carolina, and Wisconsin.

    Grouping institutions by admissions selectivity to determine whether this factor explains the lower pass rates reveals that the difference in pass rates for test takers of color between different types of institutions decreases, but only slightly. Among higher-selectivity institutions, aspiring teachers of color at non-MSIs outperform those at MSIs by eight percentage points; among lower-selectivity institutions, the difference is nine percentage points.

    In the 21 states that provided data to calculate walk-away rates, aspiring teachers of color at MSIs have higher walk-away rates by three percentage points, compared with those at non-MSIs.

    Implications: One of the key proposed steps to bring more teachers of color into the workforce has been to focus on expanding teacher preparation pathways at MSIs, and especially at Historically Black Colleges and Universities. This focus is well-founded: based on the data NCTQ has gathered, 12 percent of all test takers, and 23 percent of test takers of color, attend MSIs. Speaking to the importance of these institutions, authors from the National Academies of Sciences write, “MSIs are crucial resources for helping many students of color overcome historically entrenched obstacles to social and economic opportunity” but warn that, “[h]istorical inequities in funding have left the MSIs with less capacity than many comprehensive universities.”

    Minority Serving Institutions did not bring about the conditions that lead to their test takers’ lower pass rates, and in many cases are trying to gain ground with fewer resources than other institutions. However, these institutions have an opportunity to make substantial headway in efforts to diversify the teacher workforce. If aspiring teachers of color at these institutions are not passing licensure tests, the institutions may need to take additional steps to diagnose test takers’ strengths and limitations in content areas, and to provide additional targeted coursework or tutoring to support test takers, helping more aspiring teachers pass on their first attempt or soon after. If walk-away rates are high, MSIs may also consider tracking who is taking tests, and intervene early to support candidates so that they attempt the test again and experience success. Additional support to help aspiring teachers of color continue their path into the classroom could include requiring more relevant coursework, test preparation, or financial help with testing fees.

    Institution size

    Comparing across 20 states with test takers of color represented at both institutions with the most and fewest test takers, the institutions with the most test takers of color tend to outperform those at institutions with the fewest, with pass rates an average of six percentage points higher across states.

    Similarly, the institutions with the most test takers in each state have smaller disparities between pass rates for white test takers and test takers of color, with a 15 percentage point disparity compared to a disparity of 23 percentage points at the institutions with the fewest test takers in each state.

    SECTION 4

    The missing teachers

    While most of the report examines first-attempt pass rates, since these figures give the best indication of where earlier interventions could reap great benefits, it is instructive to consider how many people ultimately are able to pass their licensure test using “best-attempt pass rates,” or the rate of test takers who pass after one or more attempts. Across the 44 states that have provided data to date for this three-year period, about 16,000 test takers of color do not pass their licensure test or subtest, even after multiple attempts. This represents about 30% of aspiring teachers of color across these three years.

    Adding these aspiring teachers would increase the total number of public school elementary teachers of color by roughly 6%.

    The solution, however, is not to drop licensure tests. Evidence is clear that teachers need to know the content they will be expected to teach, and that students learn more when their teachers have passed licensure tests of their content knowledge. Licensure tests are often accused of contributing to inequities, when in fact they are shining a light on the consequences of reduced opportunities for aspiring teachers of color.

    Instead, the answer is for institutions of higher education to provide instruction and aligned coursework in the core content areas that aspiring elementary teachers need, making up for the shortcomings of their educational experiences to date and helping them reach the classroom with a firm foundation in the subjects they will teach. In contrast, removing this guardrail for entry into the profession would instead shift the burden onto students, perpetuating the inequities that have brought us to this point. The 89 institutions that achieve equity and excellence for their aspiring teachers of color prove that this goal is possible.

    The following graphs illustrate how many aspiring teachers of color are taking the test in each state, and at each institution in each state, and how many of them ultimately pass the test after their “best attempt.” Because aspiring teachers can take the test multiple times, “best attempt” pass rates reflect whether their highest-scoring attempt was enough to pass.

    This data can point toward institutions that are effectively serving a large number of aspiring teachers of color, as well as those that need to better meet the needs of their aspiring teachers of color.

    Figure 9.

    Number of test takers of color who pass or fail, based on their best attempt

    View by state or select an individual state to see data for all the institutions in the state.
    Hover over bars for detail.

    Identifying institutions where more test takers of color are successful can help identify promising practices to share across institutions. Likewise, identifying those institutions where many test takers of color struggle can point toward missed opportunities to bring more teachers of color into the classroom. View a list of institutions with too few test takers of color to report pass rates during the analysis period.

    Notes: “Unaffiliated” test takers are those reported by the state as being unaffiliated, or taking the test but not reporting having attended an institution in the state. “Additional” test takers are those reported in state-total values, but not accounted for in institution-level counts, likely because they were omitted due to small N sizes. Arizona provided data disaggregated by race/ethnicity on a state level but not an institution level.

    CONCLUSION

    Questions for states

    Building a stronger, more diverse teacher workforce necessitates asking hard questions, using data to drive the search for answers, then building policy and practical changes based on this data. Depending on the granularity of data available in the state, consider digging deeper to look at specific groups of test takers, such as Black aspiring teachers.

    1. In your state, at which types of institutions are aspiring teachers of color most successful at passing a licensure test?
    2. Are the institutions that enroll more test takers of color also the institutions where test takers of color pass the content knowledge licensure test at higher rates? If not, what strategies might help bring more test takers of color to institutions where they are likely to pass? Or to better support the test takers of color at institutions with lower pass rates?
    3. Does the disparity in pass rates between white test takers and test takers of color grow or shrink after multiple attempts? What strategies might help mitigate this?
    4. Which institutions see greater success for test takers of color and smaller disparities in pass rates for test takers of color and white test takers? What strategies from these institutions could be replicated elsewhere? What course requirements, diagnostic testing, advising, or other practices are they using to help test takers of color succeed?

    It is by grappling with these questions and using the data that we will find opportunities to provide all PreK-12 students with a well-prepared, diverse teacher workforce.

    Unfortunately, the disparity in pass rates for aspiring teachers of color often elicits calls to drop licensure tests. This narrative, that the only two options are to drop licensure tests or lose thousands of aspiring teachers of color, is false and short-sighted. Certainly, the tests themselves should be rigorously and regularly scrutinized for bias and alignment to the elementary student standards in the state, and the standards should be regularly reviewed and updated.

    To the extent that these tests instead measure ongoing inequities in aspiring teachers’ educational experiences, those inequities themselves must be righted. Removing the requirement that prospective teachers have to demonstrate their content knowledge before being assigned to teach students perpetuates a vicious cycle, sending teachers (both white teachers and teachers of color) into the classroom without demonstrating their knowledge of the core subjects they’ll need to teach their students. And research consistently shows that students furthest from opportunity are most likely to be taught by novice teachers.

    The current disparities in pass rates need not be accepted as inevitable. There is much that institutions can do to better support aspiring teachers of color. The field should boldly pursue a different approach: supporting aspiring teachers of color in developing the knowledge base that will help them reach the classroom and be effective teachers once there.

    Many of the pathways into the classroom that are expected to play an outsize role in diversifying the teacher workforce (e.g., alternate-route programs, minority serving institutions) also have lower pass rates or greater disparities in pass rates for test takers of color. The fault does not lie with these institutions; they are opening doors to many aspiring teachers who have long been ill-served by their educational experiences. These institutions can help realize the goal of bringing more aspiring teachers of color into the classroom. To do so, they can help close the gaps created by systemic inequities in education, ensuring that test takers of color have a strong foundation in the content they will be expected to teach.

    The existence of nearly 100 institutions that achieve equity and excellence for their test takers of color offers both a reason to celebrate and an opportunity to learn.

    Learn more about teacher licensure test pass rates

    To learn more, view each state’s dashboard on elementary content licensure tests and read the full 2021 report, Driven by Data or email Hannah Putman, NCTQ Managing Director of Research at hputman@nctq.org for a customized analysis of your state.

    APPENDIX

    Institutions that exhibit equity and excellence in pass rates for aspiring teachers of color


    A star indicates an institution is both less selective and has high pass rates.
     
    State Institution
    AR Harding University
    CT Quinnipiac University
    CT University of Hartford
    FL Brevard Professional Development Certification Program (alt-route)
    FL Flagler College
    FL Florida Southern College
    FL Florida State University
    FL Gulf Coast State College (community college)
    FL Northwest Florida State College
    FL Pasco Professional Development Certification Programs (alt-route)
    FL Pasco-Hernando State College (community college)
    FL Southeastern University
    FL St. Johns River State College (community college)
    FL St. Petersburg College
    FL State College of Florida, Manatee-Sarasota (community college)
    FL
    Stetson University
    FL
    University of North Florida
    FL
    University of West Florida
    FL
    Warner University
    IA
    Iowa State University
    IL
    Elmhurst College
    IL
    Illinois State University
    IL
    Loyola University Chicago
    IL
    University of Illinois Urbana-Champaign
    IN
    Ball State University
    IN
    Indiana University-Northwest
    IN
    Marian University
    IN
    Purdue University-Main Campus
    KS
    Emporia State University
    KS
    University of Kansas
    KY
    Bellarmine University
    KY
    Morehead State University
    KY
    Northern Kentucky University
    KY
    Western Kentucky University
    LA
    Southeastern Louisiana University
    MA
    Boston University
    MA
    Eastern Nazarene College
    MA
    Emmanuel College
    MA
    Gordon College
    MA
    Salem State University
    MA
    University of Massachusetts Boston
    MD
    Johns Hopkins University School of Education
    MD
    Towson University
    MD
    Urban Teachers Baltimore (alt-route)
    MN
    Bemidji State University
    MN
    Bethel University
    MN
    The College of St. Scholastica
    MO
    Central Methodist University-College of Liberal Arts and Sciences
    MO
    Missouri Western State University
    MO
    Saint Louis University
    MS
    Mississippi State University
    NC
    Meredith College
    NC
    Queens University of Charlotte
    ND
    Minot State University
    ND
    Valley City State University
    NE
    Doane University
    NE
    University of Nebraska at Omaha
    NH
    Antioch University New England Graduate School
    NJ
    Rider University
    NJ
    Rutgers University–New Brunswick
    NY
    New York University
    NY
    SUNY Cortland
    NY
    SUNY Oneonta
    NY
    Teachers College, Columbia University
    OR
    University of Oregon
    PA
    Community College of Allegheny County (community college)
    PA
    University of Pittsburgh-Pittsburgh Campus
    TN
    Belmont University
    TN

    East Tennessee State University
    TN
    The University of Tennessee, Knoxville
    TN
    Tusculum University
    TN
    Vanderbilt University
    TX
    Abilene Christian University
    TX
    Baylor University
    TX
    Region 05 Education Service Center (alt-route)
    TX
    Region 10 Education Service Center (alt-route)
    TX
    Southern Methodist University
    TX
    Stephen F. Austin State University
    TX
    Texas Christian University
    TX
    Training via E-Learning: An Alternative Certification Hybrid (alt-route)
    TX
    Wayland Baptist University
    VA
    Christopher Newport University
    VA
    Ferrum College
    VA
    University of Mary Washington
    VA
    University of Virginia
    VT
    Saint Michael's College
    VT
    University of Vermont
    WI
    University of Wisconsin-Madison
    WV
    West Virginia University
    ACKNOWLEDGEMENTS
    • Author and lead analyst

      Hannah Putman, Managing Director of Research

    • NCTQ leadership

      Dr. Heather Peske, President

    • NCTQ staff

      Shannon Holston, Ashley Kincaid, Sarah Almy, Ruth Oyeyemi, Nicole Gerber, Andrea Browne Taylor

    • Reviewers

      Special thanks to the following individuals for providing review and feedback on this project. Inclusion does not imply endorsement.

      Dia Bryant, Executive Director
      The Education Trust – New York

      Josh Crosson, Executive Director
      EdAllies

      Janellen Duffy, Senior Advisor
      JerseyCAN

      Victor J. Evans, Executive Director
      TennesseeCAN

      Nicholas Martinez, Executive Director and Co-Founder
      Transform Education Now

      Keri Rodrigues, President
      The National Parents Union

      Kate Walsh, President Emeritus
      National Council on Teacher Quality

    • Project funders

      This report is based on research funded by the following foundations. The findings and conclusions contained within are those of the authors and do not necessarily reflect positions or policies of the project funders.

      Anschutz Foundation
      Barr Foundation
      Bill & Melinda Gates Foundation
      Daniels Fund
      Gates Family Foundation
      Heinz Endowment
      The Joyce Foundation
      Sid W. Richardson Foundation
      Walton Family Foundation
      William Penn Foundation

    Endnotes
    1. Kuhfeld, M., Soland, J., & Lewis, K. (2022). The COVID-19 school year: Learning and recovery across 2020-2021. AERA Open. Retrieved from https://journals.sagepub.com/doi/pdf/10.1177/23328584221099306. Dorn, E., Hancock, B., Sarakatsannis, J., & Viruleg, E. (2021). COVID-19 and education: An emerging K-shaped recovery. McKinsey & Company. Retrieved March 3, 2022 from https://www.mckinsey.com/industries/education/our-insights/covid-19-and-education-an-emerging-k-shaped-recovery; Halloran, C., Jack, R., Okun, J. C., & Oster, E. (2021). Pandemic schooling mode and student test scores: Evidence from US states (No. w29497). National Bureau of Economic Research. Retrieved from https://www.nber.org/papers/w29497.
    2. Evidence of student achievement gains, especially for Black students with Black teachers, comes from Egalite, A., Kisida, B., & Winters, M. (2015). Representation in the Classroom: The Effect of Own-Race Teachers on Student Achievement. Economics on Education Review, 45, 44-52; Goldhaber, D., & Hansen, M. (2010). Race, Gender and Teacher Testing: How Informative a Tool is Teacher Licensure Testing and How does it Impact Student Achievement? American Educational Research Journal, 47(1), 218-51; and Dee, T.S. (2004). Teachers, Race, and Student Achievement in a Randomized Experiment. The Review of Economics and Statistics, 86(1), 195-210. Research also shows that teachers of color have higher expectations for students of color, especially for Black students and teachers (Fox, L. (2016). Seeing Potential: The Effects of Student-Teacher Demographic Congruence on Teacher Expectations and Recommendations. AERA Open, 2(1), 1-17; Gershenson, S., Holt, S., & Papageorge, N. (2016). Who Believes in Me? The Effect of Student-Teacher Demographic Match on Teacher Expectations. Economics of Education Review, 52, 209-224), are more likely to assign them to gifted and talented programs (Grissom, J.A., & Redding, C. (2016). Discretion and Disproportionality: Explaining the Underrepresentation of High-Achieving Students of Color in Gifted Programs. AERA Open, 2(1), 1-25), and view their behavior more positively (Dee, T.S. (2005). A Teacher Like Me: Does Race, Ethnicity, or Gender Matter? American Economic Review, 95(2), 158-65; McGrady, P.B., & Reynolds, J.R. (2012). Racial Mismatch in the Classroom: Beyond Black-white Differences. Sociology of Education, 86(1), 3-17). Students also have fewer absences and suspensions when assigned to a same-race teacher (Holt, S., & Gershenson, S. (2015). The Impact of Teacher Demographic Representation on Student Attendance and Suspensions. IZA Discussion Paper, No 9554). A new working paper leveraging random assignment of students to teachers finds that having a teacher of color is associated with improved outcomes for students of color (in self-efficacy, classroom engagement, math and ELA achievement, and attendance, and finds positive outcomes in self-efficacy for white students assigned to a teacher of color. Blazar, D. (2021). Teachers of Color, Culturally Responsive Teaching, and Student Outcomes: Experimental Evidence from the Random Assignment of Teachers to Classes. (EdWorkingPaper: 21-501). Retrieved from Annenberg Institute at Brown University: https://doi.org/10.26300/jym0-wz02.
    3. A recent paper from the Urban Institute finds that an increase in the proportion of Hispanic teachers at a school is associated with increases in several positive outcomes for Hispanic elementary students, including small but statistically significant increases in math and reading achievement, decreases in disciplinary action and dropout rates, increase in high school graduation rates, and evidence of increased college persistence and earning a bachelor’s degree for some grades. Lindsay, C., Monarrez, T., & Luetmer, G. (2021). The Effects of Teacher Diversity on Hispanic Student Achievement in Texas. Urban Institute. Retrieved February 18, 2022 from https://www.urban.org/sites/default/files/publication/105325/the-effects-of-teacher-diversity-on-hispanic-student-achievement-in-texas_0_0.pdf.
    4. Perhaps most notable is research finding improved high school completion rates and college matriculation for Black students who have at least one Black elementary school teacher. Gershenson, S., Hart, C. M., Hyman, J., Lindsay, C., & Papageorge, N. W. (2018). The long-run impacts of same-race teachers (No. w25254). National Bureau of Economic Research.
    5. Blazar, David. (2021). Teachers of Color, Culturally Responsive Teaching, and Student Outcomes: Experimental Evidence from the Random Assignment of Teachers to Classes. (EdWorkingPaper: 21-501). Annenberg Institute at Brown University. Retrieved from https://doi.org/10.26300/jym0-wz02
    6. Ingersoll, R. M., Merrill, E., Stuckey, D., & Collins, G.. (2018). Seven Trends: The transformation of the teaching force – Updated October 2018. CPRE Research Reports. Retrieved from https://repository.upenn.edu/cpre_researchreports/108
    7. Putman, H., Hansen, M., Walsh, K., & Quintero, D. (2016). High Hopes and Harsh Realities: The Real Challenges to Building a Diverse Workforce. Washington, D.C.: Brookings Institution. https://www.nctq.org/publications/High-Hopes-and-Harsh-Realities:-The-real-challenges-to-building-a-diverse-workforce.
    8. To read more about research on the predictive validity of licensure tests, see Driven by Data: Appendix B – Literature review on licensure test predictive validity, available at https://www.nctq.org/dmsView/NCTQ_Driven_by_Data_Appendix_B
    9. Putman, H. & Walsh, K. (2019). A Fair Chance: Simple steps to strengthen and diversify the teacher workforce. Washington, D. C.: National Council on Teacher Quality. Retrieved from https://www.nctq.org/publications/A-Fair-Chance; Putman, H. & Walsh, K. (2021). Driven by Data: Using licensure tests to build a strong, diverse teacher workforce. Washington, D.C.: National Council on Teacher Quality. Retrieved from https://www.nctq.org/publications/Driven-by-Data:-Using-Licensure-Tests-to-Build-a-Strong,-Diverse-Teacher-Workforce.
    10. These four areas are generally identified as the core elementary subjects by sources such as the IES Schools and Staffing Survey. (2012). Average number of hours and percentage of the student school week that regular full-time public school teachers of first through fourth grade in self-contained classrooms spent on each of four subjects, total instruction hours per week on four subjects, total time spent delivering all instruction per week, and average length of student school week: selected years 1987-1988 through 2011-2012. In U.S. Department of Education, National Center for Education Statistics, Schools and Staffing Survey. Retrieved from https://nces.ed.gov/surveys/sass/tables/sass1112_20161012001_t1n.asp.
    11. Kalogrides, D., & Loeb, S. (2013). Different teachers, different peers: The magnitude of student sorting within schools. Educational Researcher, 42(6), 304–316.; Goldhaber, D., Lavery, L., & Theobald, R. (2015). Uneven playing field? Assessing the teacher quality gap between advantaged and disadvantaged students. Educational Researcher, 44(5), 293–307. Retrieved from https://citeseerx.ist.psu.edu/viewdoc/download?doi=10.1.1.1022.2346&rep=rep1&type=pdf; Steele, J. L., Pepper, M. J., Springer, M. G., & Lockwood, J. R. (2015). The distribution and mobility of effective teachers: Evidence from a large, urban school district. Economics of Education Review, 48(5), 86–101.; Goldhaber, D., Quince, V., & Theobald, R. (2016a, December). Has it always been this way? Tracing the evolution of teacher quality gaps in U.S. public schools (CALDER Working Paper No. 171). National Center for Analysis of Longitudinal Data in Education Research. Retrieved from https://files.eric.ed.gov/fulltext/EJ1167060.pdf.
    12. For example, while NAEP scores are relatively low across all groups of students, they are notably lower for students of color. In 12th grade math, 32% of white students earned a Proficient score, compared with 8% of Black students and 11% of Hispanic students (U.S. Department of Education, Institute of Education Sciences, National Center for Education Statistics, National Assessment of Educational Progress (NAEP), various years, 1990–2019 Mathematics Assessments. Retrieved from https://www.nationsreportcard.gov/mathematics/nation/achievement/?grade=12. In 12th grade reading, 47% of white students scored proficient, compared with 17% of Black students and 25% of Hispanic students. (U.S. Department of Education, Institute of Education Sciences, National Center for Education Statistics, National Assessment of Educational Progress (NAEP), various years, 1992–2019 Reading Assessments. Retrieved from https://www.nationsreportcard.gov/reading/nation/achievement/?grade=12). In 12th grade Science, 30% of white students scored proficient compared with 6% of Black students and 10% of Hispanic students. (U.S. Department of Education, Institute of Education Sciences, National Center for Education Statistics, National Assessment of Educational Progress (NAEP), various years, 2009–19 Science Assessments. Retrieved from https://www.nationsreportcard.gov/science/nation/achievement/?grade=12).
    13. See, for example, Sass, T., Hannaway, J., Xu, Z., Figlio, D., & Feng, L. (2012). Value added of teachers in high-poverty schools and lower poverty schools. Journal of Urban Economics, 72, 104–122; Goldhaber, D., Lavery, L., & Theobald, R. (2015). Uneven playing field? Assessing the teacher quality gap between advantaged and disadvantaged students. Educational Researcher, 44(5), 293–307; Steele, J. L., Pepper, M. J., Springer, M. G., & Lockwood, J. R. (2015). The distribution and mobility of effective teachers: Evidence from a large, urban school district. Economics of Education Review, 48(5), 86–101; Goldhaber, D., Quince, V., & Theobald, R. (2016). Has it always been this way? Tracing the evolution of teacher quality gaps in U.S. public schools (CALDER Working Paper No. 171). National Center for Analysis of Longitudinal Data in Education Research. Education Trust. (2008). Out-of-field teaching persists in key academic courses and high-poverty schools. The Education Trust. Retrieved from https://edtrust.org/wp-content/uploads/2013/10/SASSreportCoreProblem.pdf.
    14. The state-level data includes 44 states. The states include those that provided data to NCTQ and had completed dashboards by December 2021: AK, AL, AR, AZ, CO, CT, DC, DE, FL, HI, IA, ID, IL, IN, KS, KY, LA, MA, MD, ME, MI, MN, MO, MS, NC, ND, NE, NH, NJ, NM, NV, NY, OH, OR, PA, RI, SC, TN, TX, VA, VT, WI, WV, and WY. Only 43 states are included in the analysis of institution-level data. The segments of this analysis that focus on institution-level data (rather than aggregated state-level data) remove from the sample data from Arizona (which only provided state-level data by race/ethnicity). Also, Ohio only has sufficient test takers of color to report pass rates at one institution, and only based on first-attempt pass rates; the number of test takers at this institution based on best-attempt pass rates fell below the state’s minimum reporting requirement (10 test takers) and so was not reported. Across all states in the data set, the analysis loses about 14,500 test takers of color (24% of test takers of color in the full data set) because there are too few test takers of color at an institution to be able to report pass rate data.
    15. Notably, 47% of test takers of color across the 44 states come from Texas. This analysis averages data across states, with each state serving as a unit of analysis; while Texas produces the plurality of test takers of color in this analysis, the state is represented equally with all other states in the findings.
    16. This analysis averages data across test takers within states, and then averages across states, rather than averaging across all test takers. This means that each state is weighted equally in the analysis, so that a trend in one large state does not overwhelm the findings from the rest of the states. The analysis also focuses on differences within states (e.g., disparities in pass rates between groups of test takers or differences in pass rates between institution types) rather than on raw pass rates. Different states use different tests, and occasionally states that use the same test use different cut scores, and so pass rates are not comparable across states. On average across states, test takers of color pass at a rate 16 percentage points lower than their white peers. This gap ranges from 20 points in favor of test takers of color (in Vermont, with only 31 test takers of color across three years of data), to a 34 point gap in favor of white test takers (in South Carolina, with 228 test takers of color across three years). This gap closes only slightly, to 14 percentage points when examining best-attempt pass rates (the pass rate after test takers have taken the test one or more times). In about a third of states (FL, IA, IN, KY, MA, NC, NH, NJ, TN, VT, WI, WY), the disparity in pass rates between white test takers and test takers of color actually grows between the first-attempt and best-attempt.
    17. This data is based on programs identified as Alternate Route by the states submitting the data. Generally, alternate route programs are those where a person becomes a teacher of record while still enrolled in teacher preparation, although definitions vary. Alternate route programs comprise a mix of programs housed within four-year institutions and programs that are not part of institutions of higher education. However, for many states, if an alt-route program is housed within a traditional institution, the pass rate data is encompassed within that institution rather than broken out separately; consequently, many of the alt-route programs with pass rate data are not housed within institutions.
    18. Admissions selectivity for traditional institutions is measured using their undergraduate elementary program ratings from the 2021 Teacher Prep Review. In the absence of a rating, an equivalent score was determined using institutional median SAT/ACT scores or Barron’s selectivity ratings. Selectivity for alternate route programs was determined using non-traditional program ratings from the 2021 Teacher Prep Review; not all alternate route programs have been rated on admissions selectivity. See more here: www.nctq.org/review/standard/Admissions#scoringRubric. Institutions or programs considered “more selective” for this analysis are those that earned an A or B for admissions selectivity. ‘Very selective’ represents an A on the Teacher Prep Review Admissions standard or its scoring equivalent, ‘Selective’ a B, ‘Moderately selective’ a C, ‘Less selective’ a D, and ‘Not selective’ an F. Institutions with a C, D, or F were classified as having “lower admissions selectivity.” Based on input from the American Association of Community Colleges, all community colleges are identified as “Not selective.”
    19. NCTQ used data from College Scorecard to identify Minority Serving Institutions (MSIs). These institutions include which include Historically Black Colleges and Universities (HBCUs), Predominantly Black Institutions, Alaska Native-/Native Hawaiian-serving Institutions; Tribal Colleges and Universities; Asian American-/Native American-Pacific Islander-serving Institutions; Hispanic-serving Institutions; and Native American Non-Tribal Institutions. (College Scorecard. (2022). Technical Documentation: College Scorecard Institution-Level Data. U.S. Department of Education. https://collegescorecard.ed.gov/assets/InstitutionDataDocumentation.pdf). An additional 13% of test takers of color, on average, attended institutions that could not be identified as either MSIs or non-MSIs.
    20. Smith, R., Snow, P., Serry, T., & Hammond, L. (2021). The role of background knowledge in reading comprehension: A critical review. Reading Psychology, 42(2), 1-27.
    21. Recht, D. R., & Leslie, L. (1988). Effect of prior knowledge on good and poor readers’ memory of text. Journal of Educational Psychology, 80(1), 16; Schneider, W., Körkel, J., & Weinert, F. E. (1989). Domain-specific knowledge and memory performance: A comparison of high- and low-aptitude children. Journal of Educational Psychology, 81(3), 306; Smith, R., Snow, P., Serry, T., & Hammond, L. (2021). The role of background knowledge in reading comprehension: A critical review. Reading Psychology, 42(2), 1-27.
    22. Tyner, A., & Kabourek, S. (2020). Social studies instruction and reading comprehension: Evidence from the early childhood longitudinal study. Washington, D.C.: Thomas B. Fordham Institute. Retrieved from https://fordhaminstitute.org/national/resources/social-studies-instruction-and-reading-comprehension.
    23. Research on teacher preparation programs (both traditional and alternative) in New York City found that the amount of English Language Arts (ELA) coursework completed by teacher candidates correlated with increased ELA student achievement in the second year of teaching, (Boyd, D. J., Grossman, P. L., Lankford, H., Loeb, S., & Wyckoff, J. (2009). Teacher preparation and student achievement. Education Evaluation and Policy Analysis, 31(4), 416-440.) Another study found no correlation between teachers’ content courses and students’ achievement. (Harris, D. N., & Sass, T. R. (2011). Teacher training, teacher quality and student achievement. Journal of Public Economics, 95, 798-812. Note that this study’s findings run contrary to the conclusions of most strong research in the field. Research conducted in another large urban district also revealed a positive relationship between teachers’ science knowledge and student achievement (Diamond, B. S., Maerten-Rivera, J., Rohrer, R. E., & Lee, O. (2014). Effectiveness of a curricular and professional development intervention at improving elementary teachers’ science content knowledge and student achievement outcomes: Year 1 results. Journal of Research in Science Teaching, 51(5), 635-658.) Another study in which teachers completed coursework aimed at improving their content knowledge also found improvement in student performance relative to a control group. This study relied on professional development coursework designed for teachers, rather than the general population. However, it provides supporting evidence that teachers’ content knowledge influences student learning (Heller, J. I., Daehler, K. R., Wong, N., Shinohara, M., & Miratrix, L. W. (2012). Differential effects of three professional development models on teacher knowledge and student achievement in elementary science. Journal of Research in Science Training, 49(3), 333-362.) Several studies also found that when teachers use content-rich curricula, their students’ reading comprehension improves, although these studies did not examine teachers’ content knowledge directly. Cabell, S. Q., & Hwang, H. (2020). Building content knowledge to boost comprehension in the primary grades. Reading Research Quarterly, 55, S99-S107; Gray, A. M., Sirinides, P. M., Fink, R. E., & Bowden, A. B. (2022). Integrating literacy and science instruction in kindergarten: Results from the efficacy Study of Zoology One. Journal of Research on Educational Effectiveness, 15(1), 1-27; Hwang, H., Cabell, S. Q., & Joyner, R. E. (2021). Effects of Integrated Literacy and Content-area Instruction on Vocabulary and Comprehension in the Elementary Years: A Meta-analysis. Scientific Studies of Reading, 1-27.
    24. In an NCTQ survey, 98% of state education agency leaders (out of 41 who responded to this survey item) and 87% of teacher preparation program leaders (out of 228 who responded to this survey item) agreed or strongly agreed with the statement, “Elementary teachers who have knowledge of a core content area are more likely to effectively teach that content.” Respondents also overwhelmingly agreed with the statements, “Teachers cannot teach what they do not know” and “Elementary teachers who have knowledge of a core content can more efficiently plan lessons in that area.”
    25. National Academies of Sciences, Engineering, and Medicine. (2019). Monitoring educational equity. Washington, DC: The National Academies Press. Retrieved from https://www.nap.edu/catalog/25389/monitoring-educational-equity.
    26. For example, 2015 science assessment data finds that 51% of white students were proficient or advanced, compared with 15% of Black students and 21% of Hispanic students. This same year, 55% of students who were not eligible for the National School Lunch Program (NSLP) scored proficient or advanced, compared with only 22% who were eligible for the NSLP. National Center for Education Statistics. (2015). National Assessment of Educational Progress: 2015 science assessment. Washington, DC: National Center for Education Statistics, Institute of Education Sciences, U.S. Dept. of Education. Retrieved from https://www.nationsreportcard.gov/science_2015/#acl?grade=4.
    27. These studies were identified using combinations of the following search terms: “elementary content” “licens* test” “certification test” “teacher” “student outcomes” “elementary” “core subjects” “core knowledge” “outcomes” “student learning” “learning gains” “Praxis” “teacher effective” “race” “Black” “Latino” “Hispanic” “Latinx” “predictive validity” “predict*” “licensing” “certification” “Pearson”.
    28. Araujo P. M. D., Heineck, G., & Cruz Aguayo, Y. (2020). Does test-based teacher recruitment work in the developing world? Experimental evidence from Ecuador (No. 165). BERG Working Paper Series; Boyd, D., Lankford, H., Loeb, S., Rockoff, J., & Wyckoff, J. (2008). The narrowing gap in New York City teacher qualifications and its implications for student achievement in high-poverty schools (No. w14021). National Bureau of Economic Research; Chingos, M. M., & Peterson, P. E. (2011). It’s easier to pick a good teacher than to train one: Familiar and new results on the correlates of teacher effectiveness. Economics of Education Review, 30(3), 449-465; Clotfelter, C. T., Ladd, H. F., & Vigdor, J. L. (2006). Teacher-student matching and the assessment of teacher effectiveness. The Journal of Human Resources, 41(4), 778-820; Clotfelter, C. T., Ladd, H. F., & Vigdor, J. L. (2007). How and why do teacher credentials matter for student achievement? (No. w12828). National Bureau of Economic Research; Ferguson, R. F. (1991). Paying for public education: New evidence on how and why money matters. Harvard Journal on Legislation, 28, 465-498; Goldhaber, D. (2007). Everyone’s doing it, but what does teacher testing tell us about teacher effectiveness? Journal of Human Resources, 42(4), 765-794; Cowan, J., Goldhaber, D., Jin, Z., & Theobald, R. (2020). Teacher licensure tests: Barrier or predictive tool? CALDER Working Paper No. 245-1020; Shuls, J. V., & Trivitt, J. R. (2012). What makes a teacher effective? An analysis of teacher credentials and student achievement. In Annual Conference Association for Education Finance and Policy, Boston, MA; Shuls, J. V., & Trivitt, J. R. (2015). Teacher effectiveness: An analysis of licensure screens. Educational Policy, 29(4), 645-675. Shuls, J. V. (2018). Raising the bar on teacher quality: Assessing the impact of increasing licensure exam cut-scores. Educational Policy, 32(7), 969-992.
    29. Goldhaber, D., Jin, Z., & Theobald, R. (2020).
    30. Rockoff, J. E., Jacob, B. A., Kane, T. J., & Staiger, D. O. (2011). Can you recognize an effective teacher when you recruit one? Education Finance and Policy, 6(1), 43-74.
    31. Hanushek, E. A. (1997). Assessing the effects of school resources on student performance: An update. Educational Evaluation and Policy Analysis, 19(2), 141-164; Goldhaber, D., & Hansen, M. (2010). Race, gender, and teacher testing: How informative a tool is teacher licensure testing? American Educational Research Journal, 47(1), 218-251; Shuls, J. V. (2018). Raising the bar on teacher quality: Assessing the impact of increasing licensure exam cut-scores. Educational Policy, 32(7), 969-992; Buddin, R., & Zamarro, G. (2009). Teacher qualifications and student achievement in urban elementary schools. Journal of Urban Economics, 66(2), 103-115.
    32. Hanushek, E. A. (1997). Assessing the effects of school resources on student performance: An update. Educational Evaluation and Policy Analysis, 19(2), 141-164.
    33. Goldhaber, D., & Hansen, M. (2010). Race, gender, and teacher testing: How informative a tool is teacher licensure testing? American Educational Research Journal, 47(1), 218-251.
    34. Buddin, R., & Zamarro, G. (2009). Teacher qualifications and student achievement in urban elementary schools. Journal of Urban Economics, 66(2), 103-115.
    35. Cowan, J., Goldhaber, D., Jin, Z., & Theobald, R. (2020). Teacher licensure tests: Barrier or predictive tool? CALDER Working Paper No. 245-1020. Retrieved January 22, 2021, from https://caldercenter.org/publications/teacher-licensure-tests-barrier-or-predictive-tool.
    36. Evidence of student achievement gains, especially for Black students with Black teachers, comes from Egalite, A., Kisida, B., & Winters, M. (2015). Representation in the Classroom: The Effect of Own-Race Teachers on Student Achievement. Economics on Education Review, 45, 44-52; Goldhaber, D., & Hansen, M. (2010). Race, Gender and Teacher Testing: How Informative a Tool is Teacher Licensure Testing and How does it Impact Student Achievement? American Educational Research Journal, 47(1), 218-51; and Dee, T.S. (2004). Teachers, Race, and Student Achievement in a Randomized Experiment. The Review of Economics and Statistics, 86(1), 195-210. Research also shows that teachers of color have higher expectations for students of color, especially for Black students and teachers (Fox, L. (2016). Seeing Potential: The Effects of Student-Teacher Demographic Congruence on Teacher Expectations and Recommendations. AERA Open, 2(1), 1-17; Gershenson, S., Holt, S., & Papageorge, N. (2016). Who Believes in Me? The Effect of Student-Teacher Demographic Match on Teacher Expectations. Economics of Education Review, 52, 209-224), are more likely to assign them to gifted and talented programs (Grissom, J.A., & Redding, C. (2016). Discretion and Disproportionality: Explaining the Underrepresentation of High-Achieving Students of Color in Gifted Programs. AERA Open, 2(1), 1-25), and view their behavior more positively (Dee, T.S. (2005). A Teacher Like Me: Does Race, Ethnicity, or Gender Matter? American Economic Review, 95(2), 158-65; McGrady, P.B., & Reynolds, J.R. (2012). Racial Mismatch in the Classroom: Beyond Black-white Differences. Sociology of Education, 86(1), 3-17). Students also have fewer absences and suspensions when assigned to a same-race teacher (Holt, S., & Gershenson, S. (2015). The Impact of Teacher Demographic Representation on Student Attendance and Suspensions. IZA Discussion Paper, No 9554). A new working paper leveraging random assignment of students to teachers finds that having a teacher of color is associated with improved outcomes for students of color (in self-efficacy, classroom engagement, math and ELA achievement, and attendance, and finds positive outcomes in self-efficacy for white students assigned to a teacher of color. Blazar, D. (2021). Teachers of Color, Culturally Responsive Teaching, and Student Outcomes: Experimental Evidence from the Random Assignment of Teachers to Classes. (EdWorkingPaper: 21-501). Retrieved from Annenberg Institute at Brown University: https://doi.org/10.26300/jym0-wz02.
    37. Texas has a fifth subtest covering fine arts, health, and physical education. Two of the states that use a test that separately measures each subject, South Dakota and Utah, did not provide pass rate data to NCTQ and so are not included in this analysis.
    38. On the most commonly required elementary content licensure test, ETS data shows that while 75% of white test takers pass after one or more attempts, that rate drops to 57% for Hispanic test takers and to only 38% for Black test takers. Putman, H., & Walsh, K. (2019). A Fair Chance: Simple steps to strengthen and diversify the teacher workforce. Washington, D.C.: National Council on Teacher Quality. Retrieved from https://www.nctq.org/publications/A-Fair-Chance. Numerous other studies have pointed to disparities in pass rates for candidates of color: Goldhaber, D., & Hansen, M. (2010). Race, gender, and teacher testing: How informative a tool is teacher licensure testing? American Educational Research Journal, 47(1), 218-251; Stedman, J.B., & Mangan, B. F. (2004). Pass rates as an accountability measure for teacher education programs. Congressional Research Service, Library of Congress; Redmond, C., Clinedinst, M., & O’Brien, C. (2000). Educating the emerging majority: The role of minority-serving colleges & universities in confronting America’s teacher crisis. A Report from the Alliance for Equity in Higher Education (this study argues that using test scores as gatekeeper keeps aspiring teachers of color from pursuing career); Gitomer, D. H., & Latham, A. S. (2000). Generalizations in teacher education: Seductive and misleading. Journal of Teacher Education, 51(3), 215-220; Stedman & Mangan, 2004; Nettles, M. T., Scatton, L. H., Steinberg, J. H., & Tyler, L. L. (2011). Performance and passing rate differences of African American and white prospective teachers on PraxisTM examinations: A joint project of the National Education Association (NEA) and Educational Testing Service (ETS). ETS Research Report Series, 2011(1), i-82; Shuls, J. V. (2018). Raising the bar on teacher quality: Assessing the impact of increasing licensure exam cut-scores. Educational Policy, 32(7), 969-992. One study noted little difference in pass rates by race/ethnicity but found a larger disparity by test takers’ sex: Pecheone, R. L., & Chung, R. R. (2006). Evidence in teacher education: The performance assessment for California teachers (PACT). Journal of Teacher Education, 57(1), 22-36.
    39. A paper by ETS states, “…differences in test performance among groups are often regarded, in and of themselves, as an indication of test bias, ignoring performance on the external criterion that the test is designed to predict. Often, groups that perform poorly on tests also tend to perform poorly on measures of the criterion.” In other words, differences in pass rates may be indicative of disparity in the test, or they may be measuring actual differences in candidates’ knowledge. Beller, M. (2005). Test Bias. Princeton, NJ: Educational Testing Services. A study that considered processes to identify and remove bias in licensure tests noted that this process is “subjective.” Rose, E. (1994). With the phasing out of the NTE, do either the Content Mastery Examinations for Educators (CMEE) or the “Praxis Series” meet the requirements of a competency-based assessment for beginning teachers in Montana? A Report to the Board of Public Education, State of Montana.
    40. Petchauer, E. (2014). Slaying ghosts in the room: Identity contingencies, teacher licensure testing events, and African American preservice teachers. Teachers College Record, 116(7), 1-40; Bennett, C. I., McWhorter, L. M., & Kuykendall, J. A. (2006). Will I ever teach? Latino and African American students’ perspectives on PRAXIS I. American Educational Research Journal, 43(3), 531-575; Flippo, R. F., & Canniff, J. G. (2000). Teacher competency whitewash: How one high stakes test eliminates diversity from the teaching force. Connection: New England’s Journal of Higher Education and Economic Development, 15 (2), 28-31.
    41. Barth, P. (2004). The real value of teachers: If good teachers matter, why don’t we act like it? Thinking K-16, 6(1), Winter 2004. Washington, DC: Education Trust; Petchauer, E., Baker-Doyle, K. J., Mawhinney, L., & Ciarkowski, B. (2015). “Since feeling is first”: Exploring the affective dimension of teacher licensure exams. Multidisciplinary Journal of Educational Research, 5(2), 167-195; Bennett, McWhorter, and Kuykendall. (2006); Gitomer, D. H., Latham, A. S., & Ziomek, R. (1999). The academic quality of prospective teachers: The impact of admissions and licensure testing. (ETS Research Report No. RR-14-35.) Princeton, NJ: Educational Testing Service; Nettles, M. T., Scatton, L. H., Steinberg, J. H., & Tyler, L. L. (2011). Performance and passing rate differences of African American and white prospective teachers on Praxis examinations. (Research report ETS RR-11-08.) Retrieved from http://files.eric.ed.gov/fulltext/ED523733.pdf. One study argues that the diversity of the teacher prep program’s faculty itself can also support candidates of color in passing licensure tests. Wenglinsky, H. (2000). Teaching the teachers: Different settings, different results. Policy Information Report. Princeton, NJ: Educational Testing Center.
    42. Smith argues that licensure tests are screening test takers for race rather than teacher quality. Smith, G. P. (2000). The minority teacher shortage and testing. Multicultural Perspectives, 2(3), 34-38.
    43. Tellez, K. (2003). Three themes on standards in teacher education: Legislative expediency, the role of external review, and test bias in the assessment of pedagogical knowledge. Teacher Education Quarterly, 30(1), 9-18.
    44. Bennett et al. share the experiences of focus group participants. Bennett, C. I., McWhorter, L. M., & Kuykendall, J. A. (2006). Will I ever teach? Latino and African American students’ perspectives on PRAXIS I. American Educational Research Journal, 43(3), 531-575. Flippo and Canniff assert that linguistic barriers may drive lower passing rates, though do not support this assertion. Flippo, R. F., & Canniff, J. G. (2000). Teacher competency whitewash: How one high stakes test eliminates diversity from the teaching force. Connection: New England’s Journal of Higher Education and Economic Development, 15 (2), 28-31.
    45. To learn more about this issue and how states are addressing it, see Driven by Data: Appendix D – Non-program test takers in licensure test data, available at https://www.nctq.org/dmsView/NCTQ_Driven_by_Data_Appendix_D.
    46. Test takers of color pass at a rate no more than 5 percentage points below the rate of white test takers; at 85 of these institutions, test takers of color pass at a higher rate than white test takers. Note that at all but 17 of these 89 institutions, pass rates for white test takers also exceed the state average. At these 17 institutions, pass rates for white test takers are below the state average by an average of 6 percentage points.
    47. Admissions selectivity for traditional institutions is measured using their undergraduate elementary program ratings from the 2021 Teacher Prep Review. In the absence of a rating, an equivalent score was determined using institutional median SAT/ACT scores or Barron’s selectivity ratings. Selectivity for alternate route programs was determined using non-traditional program ratings from the 2021 Teacher Prep Review; not all alternate route programs have been rated on admissions selectivity. See more here: www.nctq.org/review/standard/Admissions#scoringRubric. Institutions or programs considered “more selective” for this analysis are those that earned an A or B for admissions selectivity. ‘Very selective’ represents an A on the Teacher Prep Review Admissions standard or its scoring equivalent, ‘Selective’ a B, ‘Moderately selective’ a C, ‘Less selective’ a D, and ‘Not selective’ an F. Institutions with a C, D, or F were classified as having “lower admissions selectivity.” Based on input from the American Association of Community Colleges, all community colleges are identified as “Not selective.”
    48. Of the 198 Minority Serving Institutions with enough test takers to report pass rate data, 132 serve enough test takers of color and white test takers to report pass rates on both groups. Of these, only two MSIs have little or no disparity in pass rates for test takers of color, and see pass rates for test takers of color that exceed the state average.
    49. Not all test takers are enrolled in teacher preparation programs. “Preparation” here refers to any preparation from teacher preparation programs, from their institutions of higher education, as well as any preparation test takers have undertaken on their own.
    50. Putman, H. & Walsh, K. (2021). Driven by Data: Using Licensure Tests to Build a Strong, Diverse Teacher Workforce. Washington, D.C.: National Council on Teacher Quality. Retrieved from https://www.nctq.org/publications/Driven-by-Data:-Using-Licensure-Tests-to-Build-a-Strong,-Diverse-Teacher-Workforce.
    51. Averaged across states where at least some test takers of color attend both public and private institutions, most test takers attended public institutions (61% of test takers of color and 63% of white test takers). About one in three test takers attended private institutions (30% of test takers of color and 32% of white test takers), and test takers of color were slightly more represented in “other” institutions (9% of test takers of color, and 6% of white test takers). “Other” institutions include alternate route programs and unaffiliated test takers. In some cases, public institutions house alt-route programs, and so public or private institutions are not always mutually exclusive with alt-route programs. Nine states (IL, MI, MN, MO, NY, OH, OR, PA, TX) reported pass rates for “unaffiliated” test takers, or those not associated with a specific institution. In some cases, this includes test takers from out of state. In most states, these unaffiliated test takers are more diverse: an average 23% of unaffiliated test takers across the nine states identified as test takers of color compared with 19% of affiliated test takers. Pass rates for these unaffiliated test takers of color tend to be higher than for affiliated test takers, by an average of 3 percentage points. These test takers of color who do not identify with any particular institution comprise an average of a quarter of all test takers of color in these nine states, ranging from 8% of test takers of color in Missouri to 86% in Ohio (which had too few test takers of color at nearly all institutions to report institution-level pass rates). Better understanding who these unaffiliated test takers are, whether they are current teachers applying for additional endorsements, teachers or candidates in other states applying for licensure, or those who are exploring a career change, could be a powerful tool in better understanding the pipeline of teachers in these states.
    52. Note that disparities in this context are based on pass rates for all test takers in that category of institution, for example, percentage of all test takers of color at public institutions who passed the test, compared against percentage of all white test takers at public institutions who passed the test, rather than averaging across the pass rate disparities at each individual institution.
    53. Based on the 22 states that reported number of attempts by race and had at least five test takers of color who failed on their first attempt in each category of institution: AL, AR, CO, CT, DC, DE, FL, HI, ID, KS, KY, MD, MS, NC, NE, NJ, NV, NY, RI, SC, TN, and VA.
    54. Based on the 14 states that reported data on number of attempts by race for alt-route programs, CO, CT, DC, FL, HI, KY, LA, MD, NJ, NV, NY, SC, TN, and WI. In these states, public institutions have a walk-away rate of 34% for test takers of color, and private institutions have a walk-away rate of 27% for test takers of color.
    55. This data is based on programs identified as Alternate Route by the states submitting the data. Generally, alternate route programs are those where a person becomes a teacher of record while still enrolled in teacher preparation, although definitions vary. Alternate route programs comprise a mix of programs housed within four-year institutions and programs that are not part of institutions of higher education. However, for many states, if an alt-route program is housed within a traditional institution, the pass rate data is encompassed within that institution rather than broken out separately; consequently, many of the alt-route programs with pass rate data are not housed within institutions. Twenty-two states provided data broken out by race/ethnicity for alternate route programs. However, Kentucky only reports test takers of color in alt-route programs, Rhode Island only reports white test takers in alt-route programs, and North Carolina has too few test takers of color in alt-route pathways to report pass rates, and so these three states are not included in this analysis. States included in this analysis are: AR, CO, CT, DC, FL, HI, IL, KY, LA, MA, MD, MI, MO, NJ, NV, NY, PA, RI, SC, TN, TX, and WI.
    56. This data is limited to the states with both test takers of color and white test takers in alternate route programs.
    57. In many cases, this is a requirement set by the state. Thirteen states require all alt-route candidates to pass a content test prior to admission, and 16 states require this for some alt-route candidates. National Council on Teacher Quality. (2020). Program Entry. State Teacher Policy Database. [Data set]. Retrieved from https://www.nctq.org/yearbook/national/Program-Entry-93.
    58. Another 38% of aspiring teachers of color enrolled at institutions with lower admissions selectivity, and a quarter attended institutions with no selectivity data. Admissions selectivity for traditional institutions is measured using their undergraduate elementary program ratings from the 2021 Teacher Prep Review. In the absence of a rating, an equivalent score was determined using institutional median SAT/ACT scores or Barron’s selectivity ratings. Selectivity for alternate route programs was determined using non-traditional program ratings from the 2021 Teacher Prep Review. See more here: www.nctq.org/review/standard/Admissions#scoringRubric. More selective institutions are those that earned an A or B (or their scoring equivalents) on the Teacher Prep Review.
    59. Based on the 38 states where test takers of color are enrolled in both more and less selective IHEs: AL, AR, CO, CT, DC, DE, FL, HI, IA, ID, IL, IN, KS, KY, LA, MA, MD, MI, MN, MO, MS, NC, ND, NE, NH, NJ, NM, NV, NY, OR, PA, RI, SC, TN, TX, VA, VT, WI.
    60. Based on the 24 states with walk-away rates for test takers of color at both types of institutions, and at least five test takers of color who failed on their first attempt at each type of institution: AL, AR, CO, CT, DC, DE, FL, HI, ID, IN, KS, KY, LA, MD, MS, NC, NE, NJ, NV, NY, RI, SC, TN, VA.
    61. NCTQ used data from College Scorecard to identify Minority Serving Institutions (MSIs). These institutions include which include Historically Black Colleges and Universities (HBCUs), Predominantly Black Institutions, Alaska Native-/Native Hawaiian-serving Institutions; Tribal Colleges and Universities; Asian American-/Native American-Pacific Islander-serving Institutions; Hispanic-serving Institutions; and Native American Non-Tribal Institutions. (College Scorecard. (2022). Technical Documentation: College Scorecard Institution-Level Data. U.S. Department of Education. https://collegescorecard.ed.gov/assets/InstitutionDataDocumentation.pdf). An additional 13% of test takers of color, on average, attended institutions that could not be identified as either MSIs or non-MSIs.
    62. Across the 30 states with test takers of color attending both MSIs and non-MSIs: AK, AL, AR, CO, DC, DE, FL, HI, IL, IN, KS, KY, LA, MA, MD, MN, MO, MS, NC, ND, NJ, NV, NY, OR, PA, SC, TN, TX, VA, and WI.
    63. After omitting states with fewer than five test takers in one of these groups who failed on their first attempt, the 20 states with walk-away rates for test takers of color at MSIs and non-MSIs are AK, AL, AR, CO, DC, DE, FL, HI, IN, KS, KY, LA, MD, MS, NC, NJ, NV, NY, SC, TN, VA.
    64. Will, M. (2017). Can minority-serving colleges help create a more diverse teaching force. Education Week, 37(5), 6. Retrieved from https://www.edweek.org/teaching-learning/can-minority-serving-colleges-help-create-a-more-diverse-teaching-force/2017/09; Gist, C. D., Bristol, T. J., Fenwick, L. T., & Akua, C. (2021). What roles do MSIs play in preparing Teachers of Color and Indigenous Teachers? Phi Delta Kapan. Retrieved from https://kappanonline.org/msis-preparing-bipoc-teachers-gist-bristol-fenwick-akua/.
    65. Jackson, L. M., & Rudin, T. (2019). Minority-Serving Institutions. Issues in Science and Technology, 35(2), 53-55. Retrieved from https://issues.org/wp-content/uploads/2019/01/Jackson-Rudin-Minority-Serving-Institutions-53-55-Winter-2019.pdf. For more on the limited resources available to MSIs, see, for example, Espinosa, L. L., Turk, J. M., & Taylor, M. (2017). Pulling back the curtain: Enrollment and outcomes at minority serving institutions. American Council on Education. Retrieved from https://vtechworks.lib.vt.edu/bitstream/handle/10919/83978/PullingBackCurtain.pdf?sequence=1&isAllowed=y
    66. AL, CT, DC, FL, HI, ID, KS, KY, MN, ND, NE, NJ, NV, NY, OR, PA, RI, TN, TX, and VA.
    67. he five institutions in each state with the most test takers of any race/ethnicity in the state.
    68. The five institutions in each state with the fewest test takers of any race/ethnicity that still had enough test takers to report pass rates.
    69. Compared to all institutions in the “middle” (i.e., not the largest or smallest producers), test takers of color the largest producing institutions outperform those at the “middle” institutions by less than a percentage point.
    70. Across the 36 states with relevant data, when we omit states with fewer than 5 institutions and those without institution-level data by race/ethnicity.
    71. Note that New Mexico’s data is only for 2017-18, so includes a shorter time frame than other states.
    72. Using some back of the envelope calculations, there were approximately 1.8 million elementary teachers in 2017-18 (National Center for Education Statistics. (2019). Table 209.20. Digest of Education Statistics. U.S. Department of Education. https://nces.ed.gov/programs/digest/d19/tables/dt19_209.20.asp?current=yes), about 15.5% or 275,745 of whom identified as people of color (National Center for Education Statistics. (2018). Percentage distribution of school teachers, by race/ethnicity, school type, and selected school characteristics: 2017–18, National Teacher and Principal Survey. U.S. Department of Education. https://nces.ed.gov/surveys/ntps/tables/ntps1718_fltable01_t12n.asp). Adding another 16,000 teachers of color would represent an increase of 6%.