Cite this report
Putman, H. (2021) Digging Deeper: Which subjects pose the greatest challenges to aspiring elementary teachers? Washington, D.C.: National Council on Teacher Quality.

Putman, H. (2021) Digging Deeper: Which subjects pose the greatest challenges to aspiring elementary teachers? Washington, D.C.: National Council on Teacher Quality.
Unlike secondary teachers, they need to know not just one subject well, but four. In most cases, elementary teachers are expected to teach English language arts, math, science, and social studies.
Almost all states verify that elementary teachers have acquired the minimal knowledge in each of these subjects by means of a licensure test, a common requirement for entering most professions.
NCTQ recently released never-before-published data reporting the pass rates on these elementary content licensure tests. This landmark dataset,1 looking at test data primarily from 2015 to 2018, offers a window into the experiences of thousands of aspiring elementary teachers across the country, eager to earn their licenses and begin teaching.
In states with relatively strong testing systems, less than half (45%) of test takers pass the test on their first attempt. One in five test takers does not ever pass.
To understand how to support more aspiring teachers in passing these tests and earning a license, we explore the stories underneath those numbers.
Low performance in social studies cannot be definitively explained, but NCTQ has documented the history and geography coursework taken by prospective teachers, finding little evidence that prospective teachers must take courses that are relevant to the social studies (and science) that is on these tests or that is taught in elementary grades.3
1) The pass rates reported here do not distinguish between teacher candidates formally enrolled in an institution’s educator preparation program with those test takers affiliated with an institution but not enrolled in a program.
2) This analysis includes data from the 39 states (including DC) which turned data over to NCTQ prior to the July 2021 initial release of pass rate data. However not all states are depicted in the graphs below, as some states use tests that do not produce an independent score for each subject area. For more information about states’ required tests and how they combine different subjects, see this list.
3) Finally, since states use different tests and some tests are a lot harder than others, comparing pass rates between states is generally not informative. What is instructive is to look at the range of performance for all the institutions within a state.
The following sets of graphs show the average first-attempt pass rates in each of the four subjects across all of the institutions in a state as well as the performance range, illustrating significant variability among institutions in the same state.
As noted above, because states use different tests with different cut scores and levels of difficulty, comparisons should not be made across states. Differences in average pass rates between states may be driven by many factors—the structure and difficulty of the licensure test, the quality of the K-12 curricula, standards and expectations for preparation programs. However, exploring the range of performance within a state is quite informative. While institutional contexts vary widely within a state, nearly every state is likely to have institutions across the spectrum in terms of admissions selectivity, student demographics, rigor of coursework, etc.
In each subject, on average, there’s about a 50 percentage point range between the institutions with the lowest and highest first-time pass rates; but for some states, that range is far greater.
This wide variation raises some interesting questions and learning opportunities for states and institutions: At which institutions do test takers earn high pass rates in the subject, and what lessons can be learned from them? At which institutions do test takers tend to struggle, and what additional assistance, such as coursework or early diagnostic testing, can help those aspiring teachers? Are test takers who struggle typically enrolled in preparation programs or not, and if not, can their institutions identify and support them in their effort to enter the classroom? This data can focus efforts to answer these questions, leading to real improvements to help more aspiring teachers enter the classroom equipped with the knowledge they will need to be effective.
This first graph compares first-time pass rates in each of the four subjects for the 27 states using tests which are able to generate a score for at least one standalone subject area (rather than a combination of subjects).
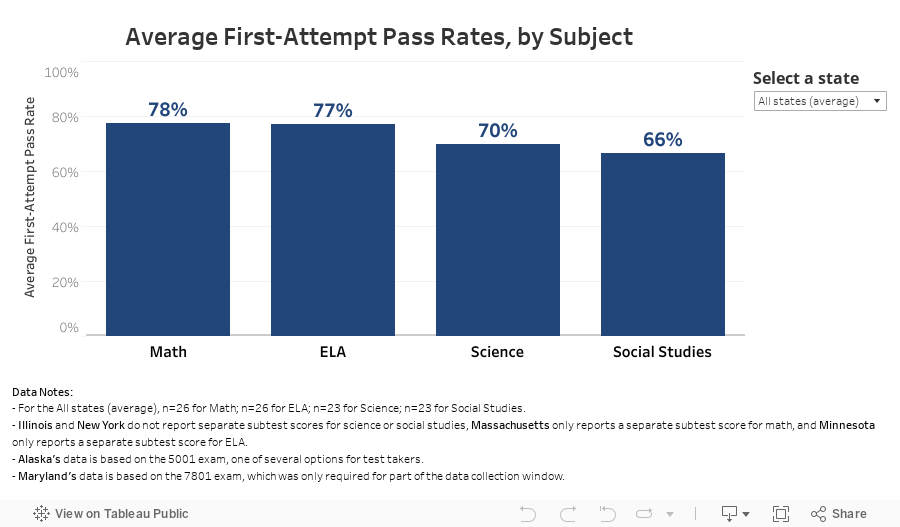
Use the filter to see which subjects are strongest or weakest for test takers in an individual state. Because some states separately measure some subjects but not others, a state may not have a bar for every subject. See Figures 2 through 5, below, to explore the variation in institutions’ pass rates in each state.
While all states allow test takers to take their tests multiple times, the “first-attempt” pass rate serves as an important indicator. A high first-attempt pass rate may reflect thorough and efficient preparation on the part of the institution. Having to take a test multiple times because of poor preparation5 comes with high costs for the candidate: additional time to study, money to pay to take the test again, and delays in earning a teaching license.
Approximately one in five people who fail on their first attempt do not retake the test. Nationally, this rate rises to nearly one in three for test takers of color, more evidence of systemic inequities in education that can be traced back well before post secondary education.
On average, states have a 55 percentage point range between the lowest and highest-performing institutions in the state, but this varies from only 23 percentage points across Idaho’s seven institutions (setting aside Alaska and Wyoming, which each only have one institution with test takers taking the relevant test) to 100 points in Florida (87 institutions), Texas (124 institutions), and Virginia (39 institutions). Not surprisingly, there is a strong relationship between the number of institutions reporting test takers in a state and the variation in pass rates among those institutions.
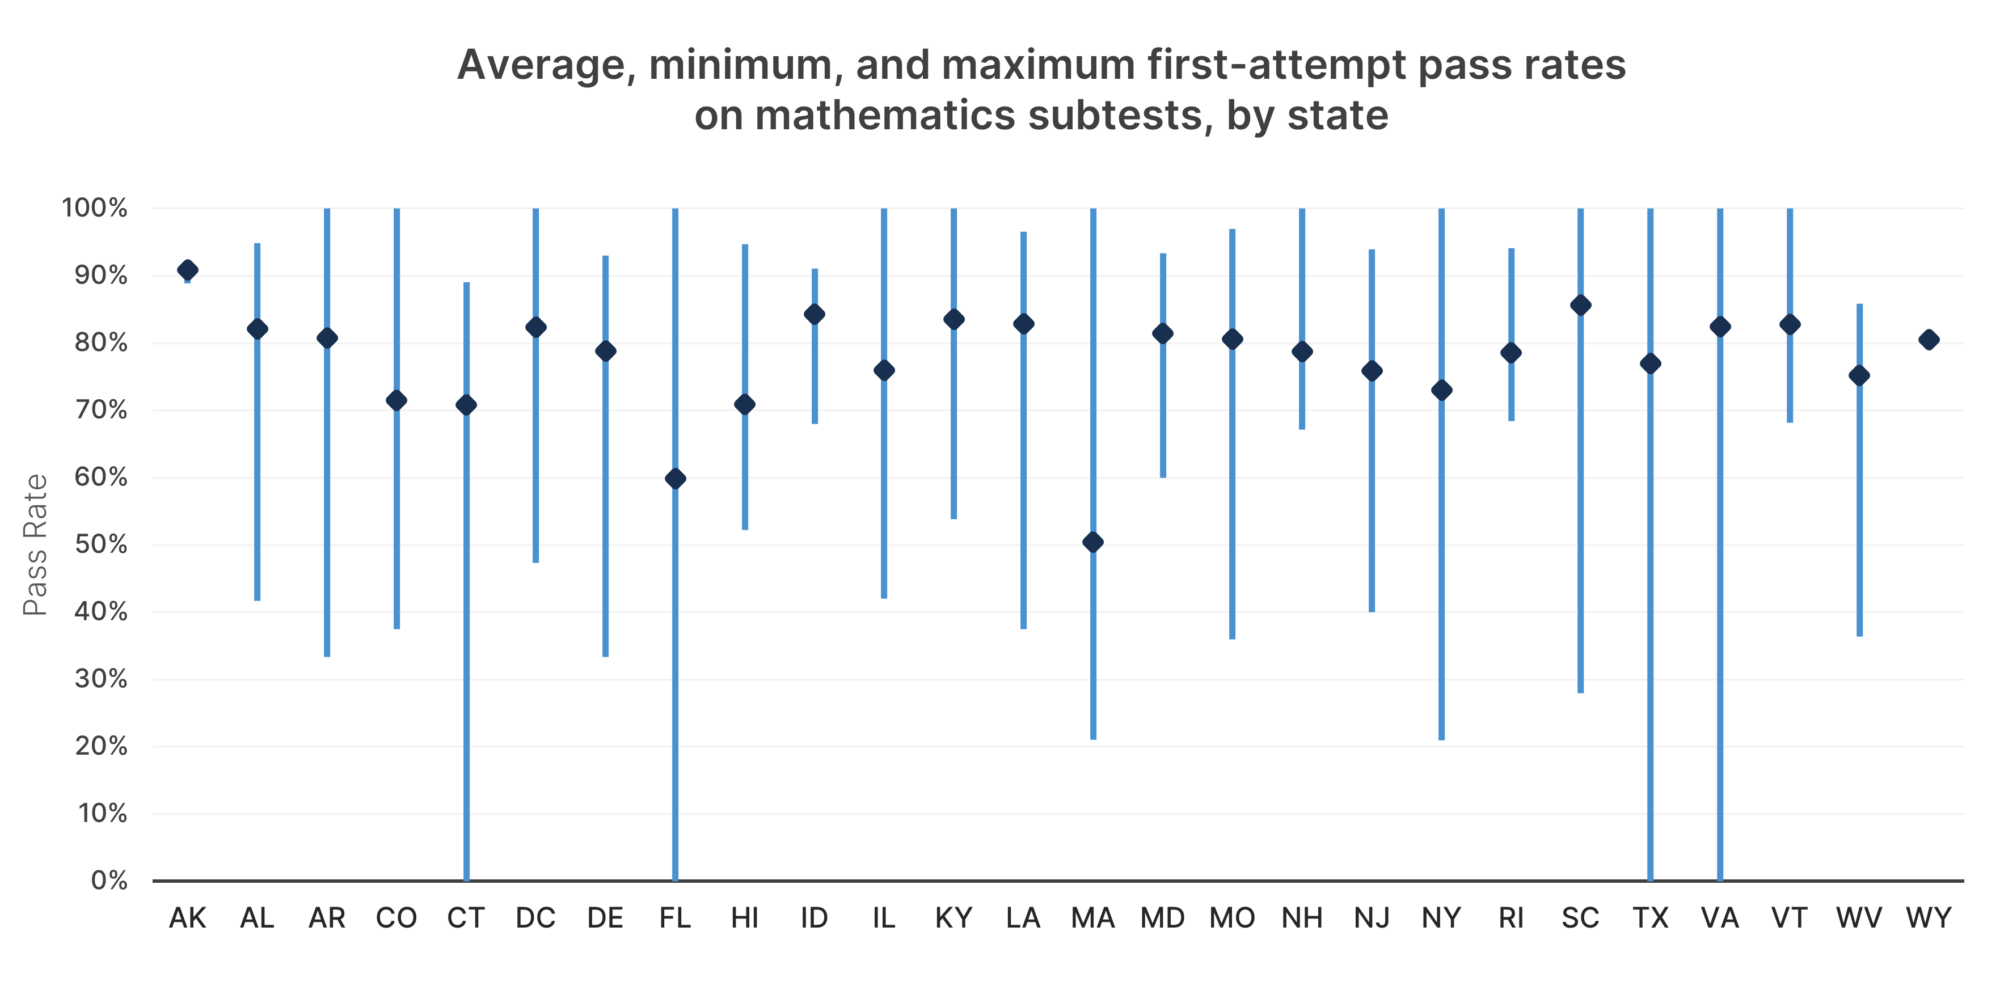
Notes: While Connecticut reports having two institutions with no test takers passing on their first attempt, these institutions do not offer elementary teacher preparation programs. Florida’s low performing program is an alternative route program. Virginia’s institution with no passing test takers closed in 2014. One of the two institutions in Texas with no passing test takers is a community college; the other is a college that offers an elementary teacher preparation program.
In ELA, states see an average range of 50 percentage points between their lowest and highest-performing institutions. This varies from 18 percentage points among Idaho’s seven institutions (again setting aside Alaska and Wyoming) to 100 points in Florida (87 institutions).
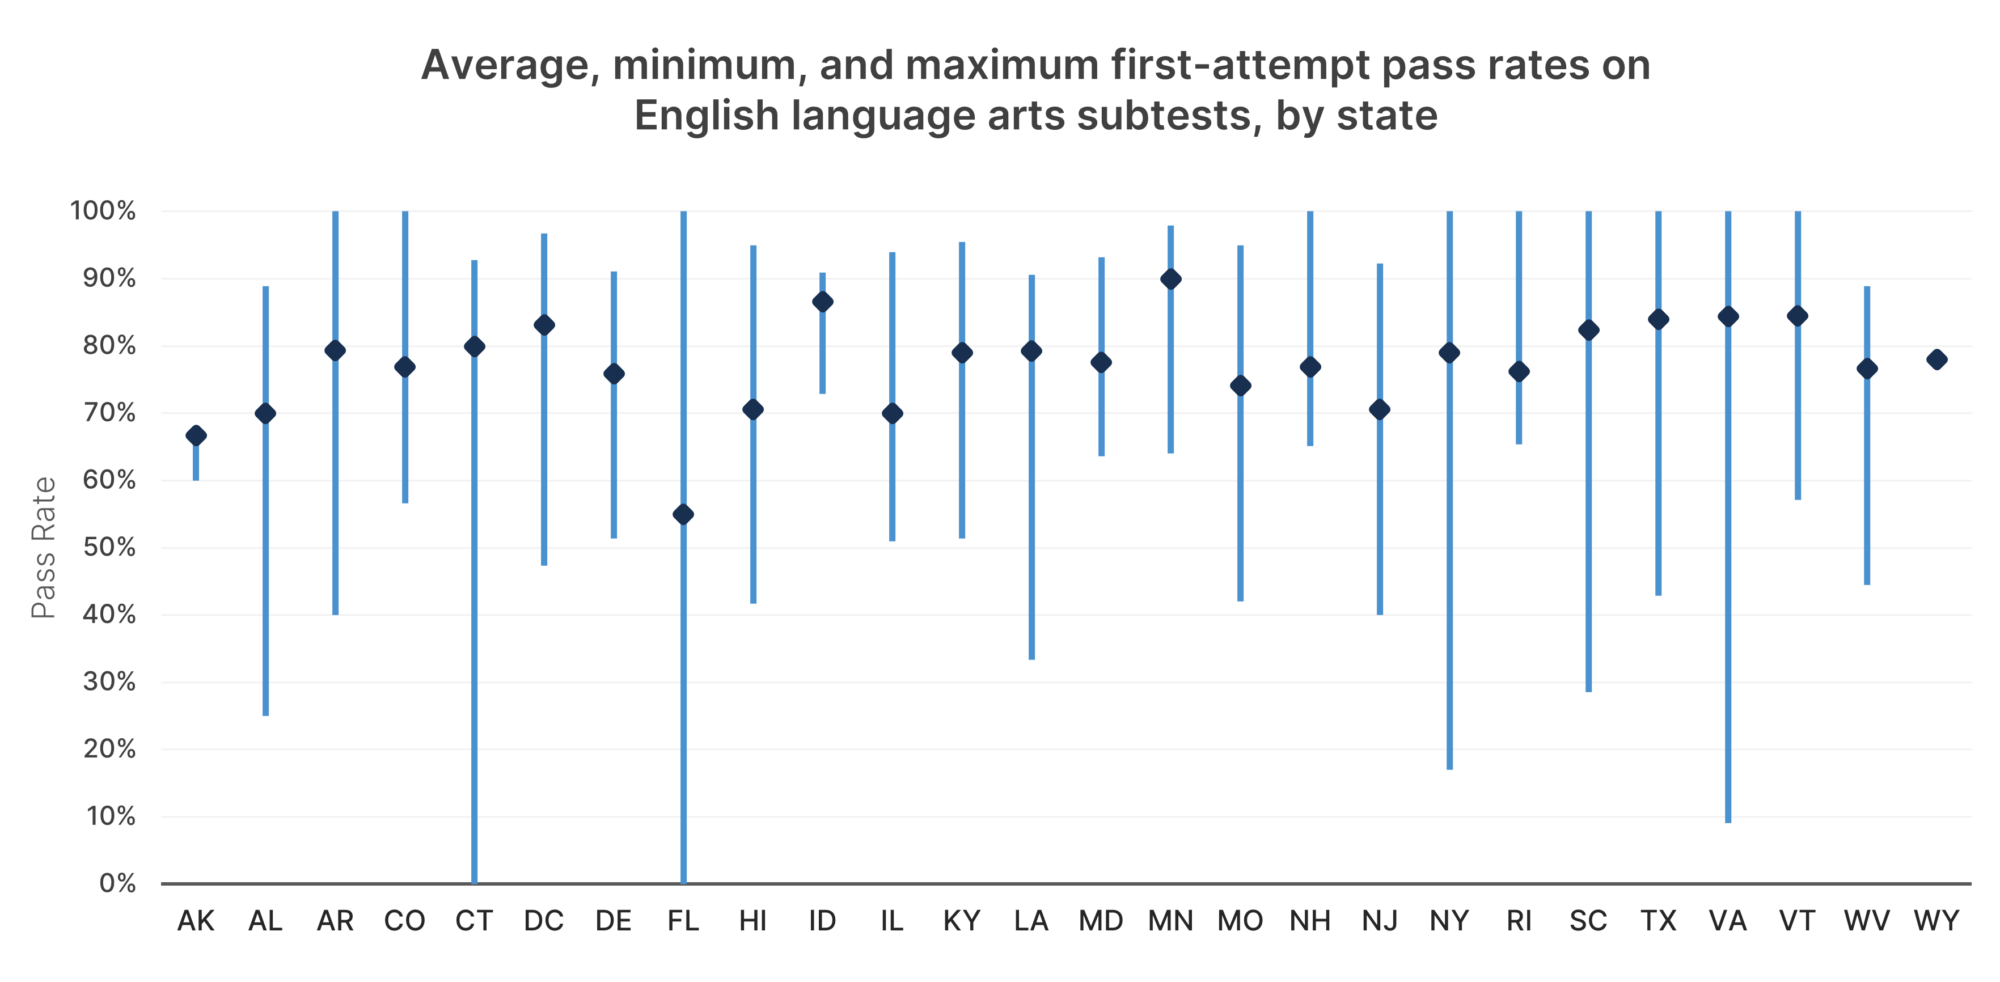
Notes: The institution in Connecticut with no passing test takers does not offer an elementary teacher preparation program. The institutions in Florida with no passing test takers are an alternative route program and a college that does not offer an elementary teacher preparation program.
Science similarly sees an average of 51 percentage points across institutions’ pass rates within a state. This varies from 13 points in Idaho to 100 points in Florida and Texas.

Notes: Two of three Florida institutions with no passing test takers are alternative route programs, and the third does not offer an elementary teacher preparation program. The college in Texas with no passing test takers does offer an elementary teacher preparation program.
Finally, in social studies, the subject that is most challenging for test takers, the average range in pass rates among institutions holds constant at 51 percentage points. Idaho again has the least variation in pass rates, at 16 percentage points difference between its lowest and highest performing institutions, compared with 100 points difference for Florida and Texas.
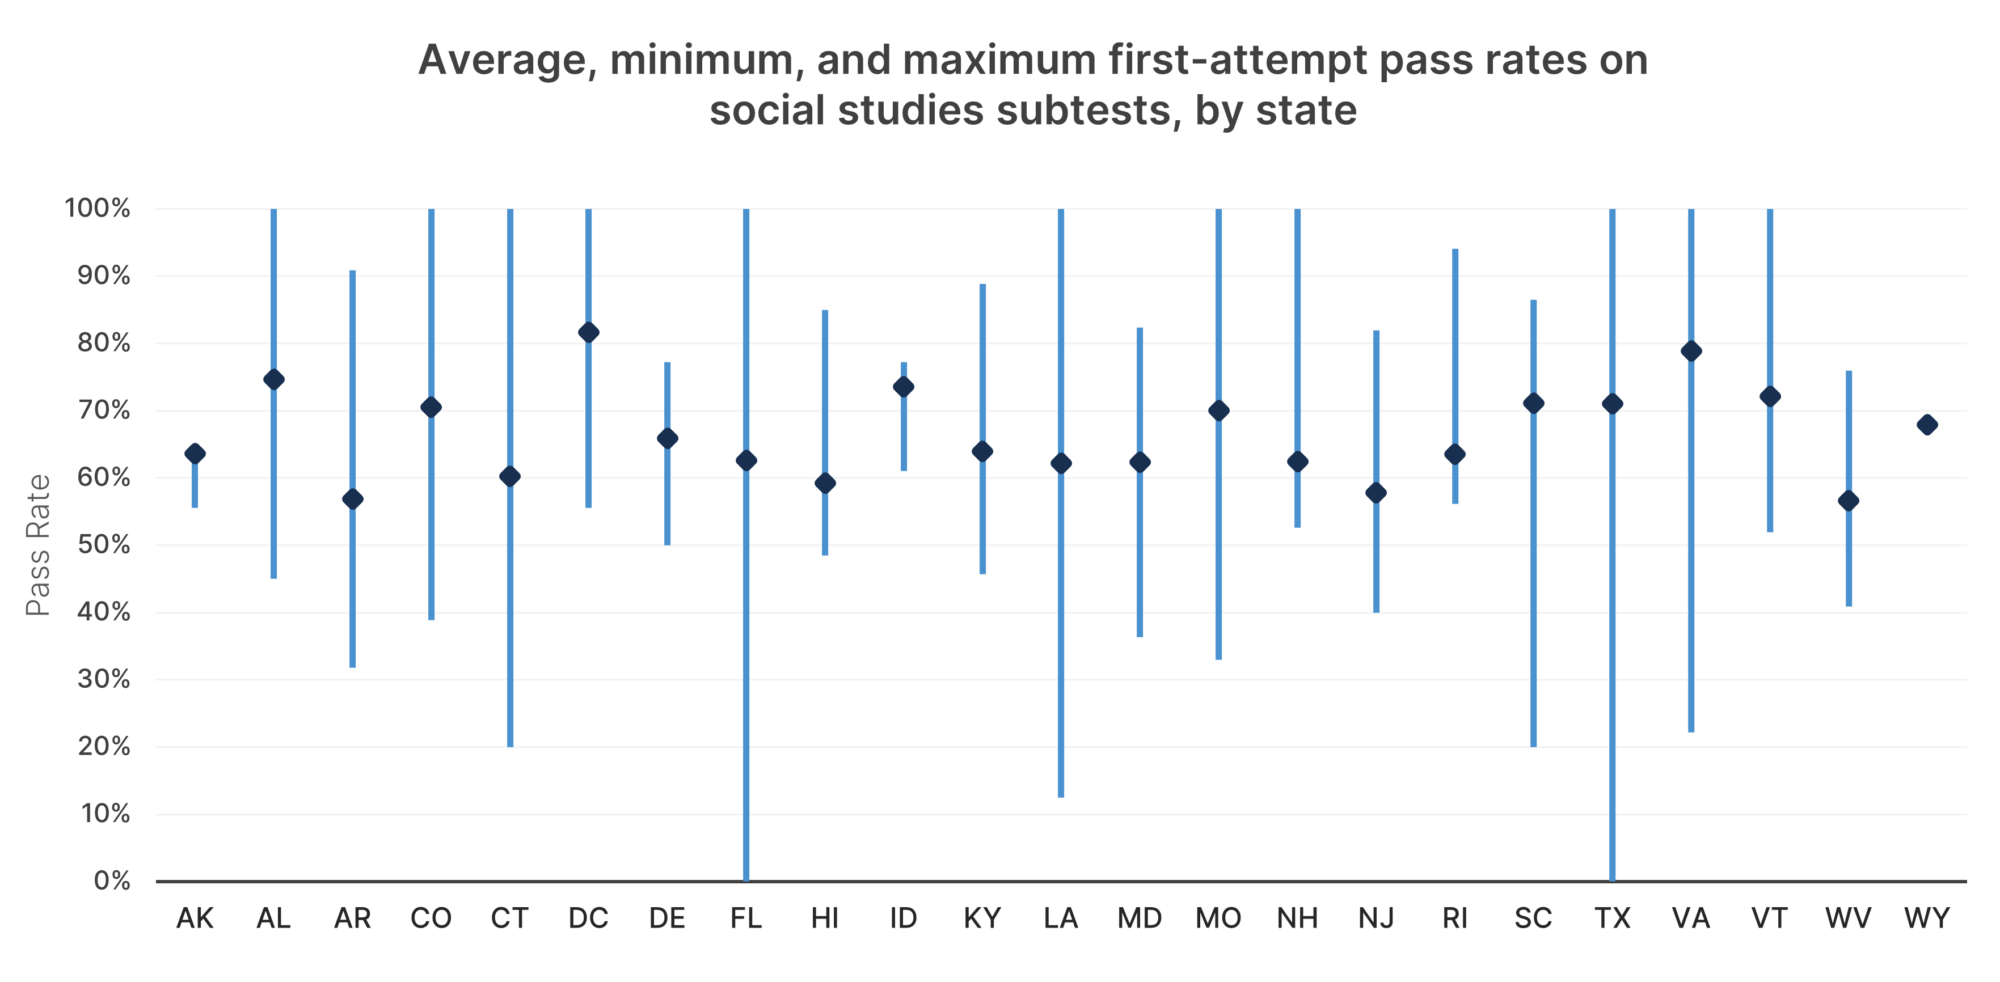
Notes: The Florida institutions with no passing test takers are alternative route programs. The college in Texas with no passing test takers does offer an elementary teacher preparation program.
While best-attempt pass rates are higher, they still show variation among institutions. Best-attempt pass rates on individual subtests are available in the downloadable excel file available on each state’s dashboard.
Thirty-three states6 selected licensure tests that combine two or more subjects under a single subtest. While these tests may cover much of the same content as a test that separately assesses each subject, the score is less informative. If a test combines, for example, science and social studies, a test taker’s strong performance in one of the two subjects can compensate for weak performance in the other, allowing the test taker to pass but then struggle with the content once in the classroom.7
In general, first-attempt pass rates on tests or subtests that combine subjects are, not surprisingly, higher than on single-subject subtests. Across states, the pass rate on subtests that combine subjects is 81%, compared with 72% for single-subject subtests.
Interestingly, when we examine the best-attempt pass rates on these tests, the pass rate disparity begins to close, though not entirely. The average combined-subject subtest pass rate across states is 90%, compared with 86% on single-subject subtests.
This closer alignment in pass rates could mean one of two things. It might indicate that separately assessing each subject creates unnecessary challenges when the end result is nearly the same. Or, it may show that the more challenging tests are better able to gauge where test takers’ weaknesses are. Many of those test takers then take steps to learn the additional content, meaning that the experience of preparing for a more rigorous test leaves them better equipped to teach their students.
For more information on the subjects included in states composite subtests, see Driven By Data, Appendix C: Examining states’ testing systems.
While this brief focuses on national trends, leaders of states, institutions of higher education, and teacher preparation programs can dig deeper into their own data to consider the following questions:
1) Which subjects pose the greatest challenge, and are there institutions whose pass rates excel that might offer promising practices?
2) In the subjects where test takers perform better, what are the common threads in their preparation (e.g., more aligned course requirements) and could that inform preparation in other subjects?
3) Are there institutions where most test takers consistently struggle to pass on their first attempt? What support (e.g., diagnostic testing, course requirements or recommendations, additional tutoring) do the institution and preparation programs currently offer, and what more could they provide? What guidance or oversight is the state providing?
4) In most states, pass rates include both people who are enrolled in teacher prep programs and those who are not. Preparation programs should be able to review pass rates for test takers enrolled in their programs.8 What are the differences in pass rates between these groups?
5) In states that combine multiple subjects within a single test or subtest, are they confident that teachers who pass have a sufficient understanding of each subject? What evidence do they have to demonstrate this?
To learn more, view each state’s dashboard on elementary content licensure tests and read the full report, Driven by Data. To support further exploration, every state that submitted data has a downloadable spreadsheet with all subtest-level data available here. Or, email Hannah Putman at hputman@nctq.org for a customized analysis of your state.
Recommended citation: Putman, H. (2021) Digging Deeper: Which subjects pose the greatest challenges to aspiring elementary teachers? Washington, D.C.: National Council on Teacher Quality.