As the school year hits full stride, we are again reminded of the myriad responsibilities that teachers take on in service of teaching our children. This year is no different, especially as teachers continue to work toward the important—yet daunting—goal of making up lost ground from pandemic-driven learning disruptions. Now more than ever, regardless of experience level, all teachers benefit from meaningful opportunities to improve and grow in their roles.
One common way that teachers reflect on and improve upon their practice is through high-quality observation and feedback channels. Recent research suggests that classroom observations can help underscore specific areas in need of improvement within instructional practice.1 In a RAND 2018 research report examining teacher perceptions of feedback and evaluation systems, the majority of teachers reported the feedback they receive on observations as somewhat or extremely helpful for improving instructional practice.2
This District Trendline examines the observation and feedback policies of 148 large districts across the U.S., including how often non-tenured and tenured teachers are observed, how long these observations last, and what form of feedback teachers receive.
What role do observations play in the larger evaluation process?
Virtually every large district requires that teachers receive a summative evaluation on a regular basis. In the 148 large districts that NCTQ tracks,3 this evaluation is typically based upon evidence from several sources, including measures of professional practice (most commonly observations), student growth measures (e.g., value-added measures or student learning objectives), and, less frequently, on measures of professional development and student surveys.4
How frequent are evaluation cycles and how often are teachers observed within each evaluation cycle?
Since the frequency of observations is generally determined on a “per evaluation cycle” basis, it is necessary to consider districts’ teacher evaluation cycles to understand the cadence of observations. Teachers are often observed several times within a summative evaluation cycle.
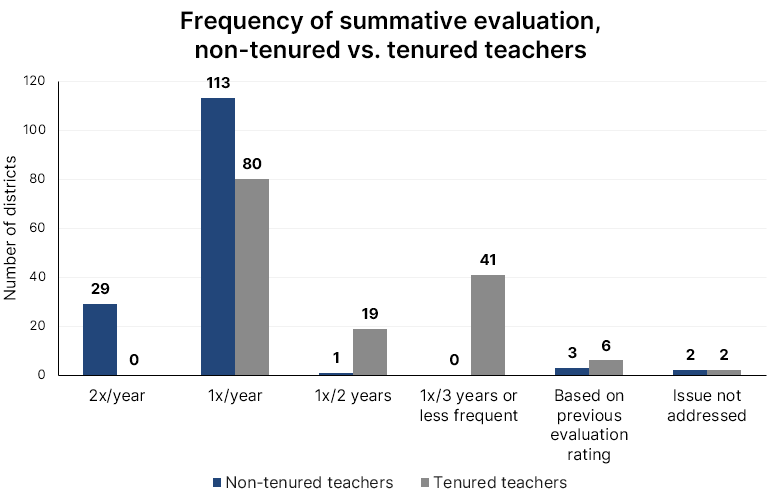
Nearly all districts in the sample (94%) specify in their contracts, school board documents, or other policy documentation that non-tenured teachers are evaluated summatively either once (113 districts) or twice (29 districts) a year. However, only about half of districts in our sample (54%) extend this same policy to teachers with tenure status. Instead, nearly as frequently, a tenured teacher is summatively evaluated every second or third year. The steepest difference based on tenure status is in Granite School District (UT), which summatively evaluates non-tenured teachers twice per year; and tenured teachers once every five years.5
Figure 1.
In terms of the total number of observations, tenured teachers are observed an average of 2.4 times per evaluation cycle, while non-tenured teachers are observed more frequently, at an average of 3.3 times per cycle (see Figure 2).6 On the low end, 42 districts require as few as one observation per evaluation cycle for more experienced, tenured teachers, and 16 of these 42 districts require only one observation for their non-tenured teachers as well.7 In contrast, Columbus City School District (OH) and Austin Independent School District (TX) both specify up to ten total observations per cycle, two of which are formal observations. The remaining observations are informal “walk-through” observations. Research suggests that frequent observations are beneficial, finding that more regular, specific feedback is associated with improved teacher performance, as measured by improvements on the Classroom Assessment and Scoring System (CLASS) observation instrument8 and student achievement.9 Additionally, recent survey data found that multiple observations are associated with higher levels of perceived usefulness: teachers observed four or more times in the school year reported more positive associations with their district’s evaluation system, compared to those teachers observed less frequently, according to RAND’s 2018 American Teacher Panel.10
Figure 2.
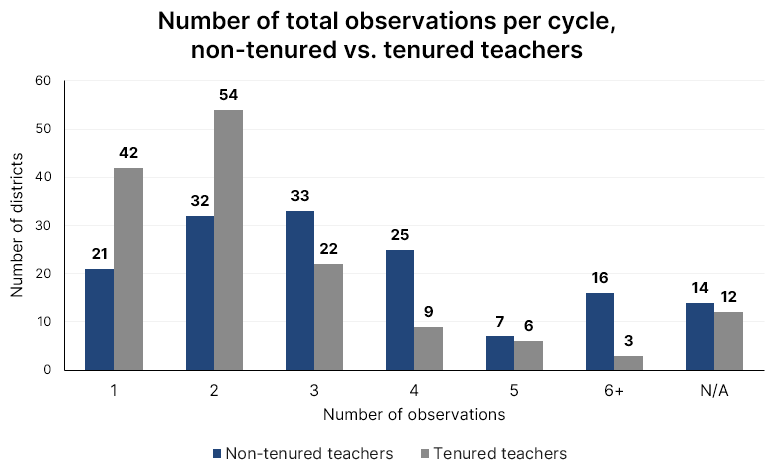
| NOTE: Several districts provide a range of total number of observations, often due to multiple informal or shorter, walk-through observation opportunities. For the purposes of this graph, the low end of total required observations was categorized. |
Interestingly, 33 districts in the sample require the same minimum number of observations for both tenured and non-tenured teachers; however, their policies differ regarding the frequency of their evaluation cycle. In other words, in these districts, a teacher with tenured status is observed less often than a non-tenured teacher because they are formally evaluated less frequently.
It’s rare that a district determines the number of observations based on previous measures of effectiveness, however, a few districts either reduce the number of required observations for high-performing non-tenured teachers (e.g., Detroit Public Schools (MI) and Clark County Public Schools (NV)), or increase the number of observations for their lowest-performing teachers (e.g., Metropolitan Nashville Public Schools (TN), and Pittsburgh Public Schools (PA)). In Detroit Public Schools, “multiple observations” in a teacher’s first two years can decrease to one observation in a teacher’s third, fourth, and fifth year if rated at least effective on the prior two year-end evaluations; Clark County Public Schools likewise reduces the required number of observations by one observation per year if a non-tenured teacher is rated Highly Effective or Effective in their second and third year. In Metropolitan Nashville Public Schools, teachers with the lowest effectiveness rating must be observed for an additional 30 minutes per evaluation cycle, as compared to teachers in other effectiveness categories (90 minutes vs. 60 minutes), and Pittsburgh Public School teachers can be observed up to 15 times if they were considered “Failing” or “Needs Improvement” on their prior evaluation.
How long is a formal observation?
Observations can either be formal—defined in this dataset and analysis as a longer observation that lasts most or all of a class period—or shorter and informal (although NCTQ defers to the district’s categorization of an observation as formal or informal when that category is made explicit). Some, but certainly not all, districts specify how many observations must be formal or informal: 89 of the 148 large districts (60%) break down the total number of observations by the type of observation for all teachers. It is more common for both non-tenured and tenured teachers to be formally observed than informally observed.11
The rest of this analysis focuses exclusively on formal observations, given that few districts set parameters around the length of time that comprise informal observations. District leaders should not discount the importance of informal observations, however. Note that when done frequently, brief observations can provide important insight into a teacher’s practice12 and can contribute to increased reliability when teachers receive multiple shorter observations. The same RAND survey mentioned above also indicated that teachers find feedback based on informal observations more helpful in improving their instructional practice compared to other types of feedback,13 and several studies have found that frequent, short observations can help boost the reliability of overall observation ratings.14
Just about one-third of districts (50) do not specify the length of formal, announced observations. Of the districts that do set a policy, the majority (45%) require a formal observation to be at least 45 minutes, the typical length of a class instructional period. Lewisville Independent School District (TX) stands out for requiring a 60-minute formal observation window. On the other side, Santa Ana Unified School District (CA) specifies a window of 15 minutes to inform a formal observation. Figure 3 depicts the minimum time that an observer must dedicate to each formal observation.
Figure 3.
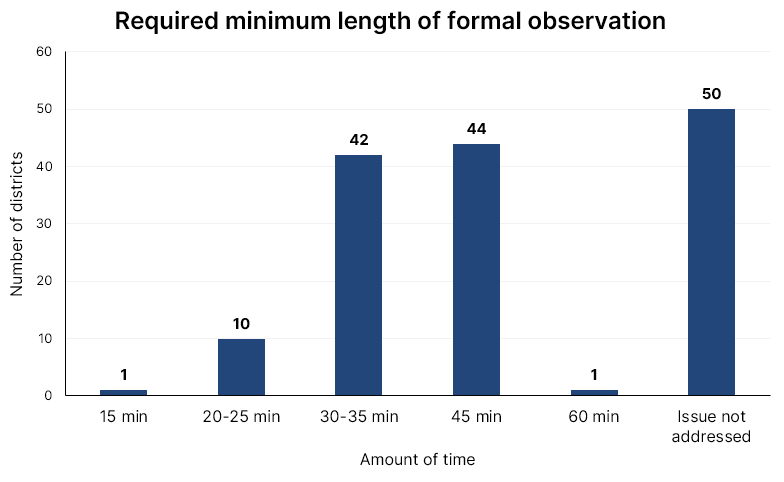
| NOTE: In instances where districts specified a range of time, the low-end value was used in order to identify the minimum required length of a formal observation. |
Each district has a distinct constellation of policies which lays out the frequency, type, amount, and length of teacher observations, that must all be accounted for when considering the total estimated time that a teacher is being formally observed throughout the year. Figure 4 plots an estimate of the minimum number of minutes per year (not per evaluation cycle) that comprise formal observations for typical teachers who previously earned an “effective” rating.
Figure 4.
| NOTE: This graph includes districts in the sample that set a clear minimum length of time for a formal observation, the number of formal observations, and the frequency of an evaluation cycle for a typical teacher rated at least effective, and assumes that observations are conducted evenly over the course of an evaluation cycle. This totals 67 districts, omitting 81 districts that do not specify this information in full for both tenured and non-tenured teachers. |
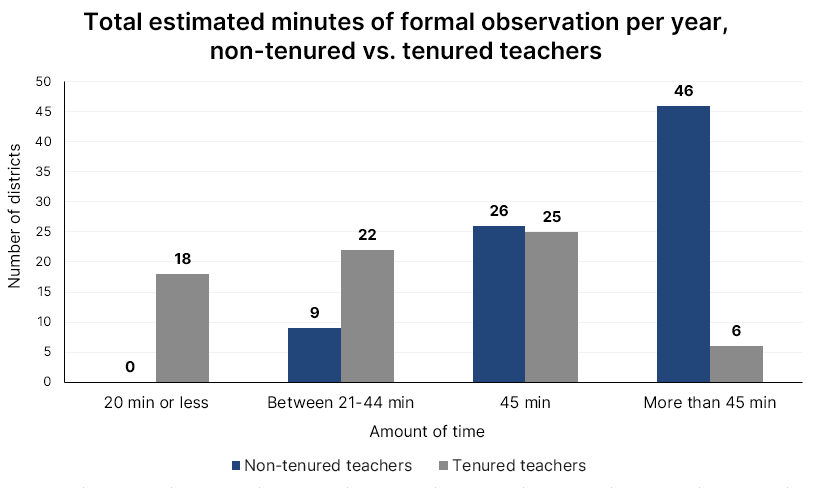
When comparing the total number of minutes per year across tenure status, Portland Public Schools (OR) stands out for requiring an estimated 120 minutes per year of formal observation for more novice, non-tenured teachers, in addition to “ongoing informal observations.” By contrast, novice, non-tenured teachers in Corona-Norco Unified School District (CA) are observed an estimated 30 minutes per year, and no informal or “walk-through” observations are specified. Figure 5 graphs the difference in the total time of formal observations per year between non-tenured and tenured teachers in the same district.
Figure 5.
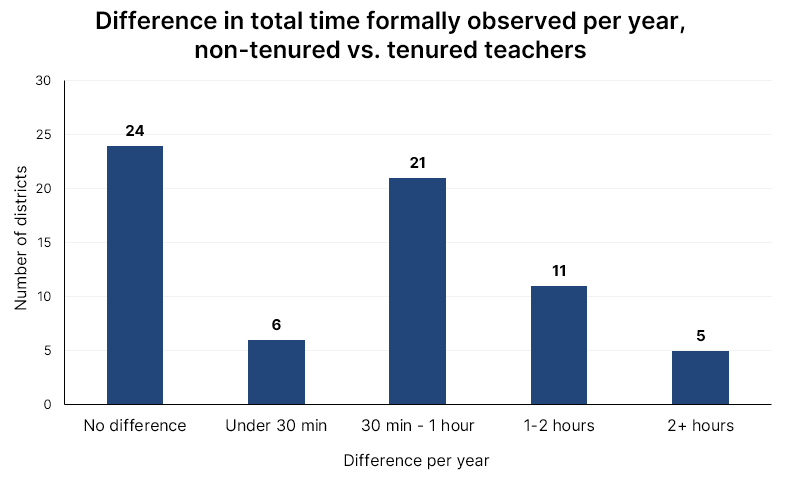
| NOTE: This graph includes districts in the sample that set a clear minimum length of time for a formal observation, the number of formal observations, and the frequency of an evaluation cycle for a typical teacher rated at least effective and assuming that observations are conducted evenly over the course of an evaluation cycle. This totals 67 districts, omitting 81 districts that do not specify this information in full for both tenured and non-tenured teachers. |
How can districts mitigate potential bias in teacher observations?
Several recent studies have demonstrated concerning biases in teacher observation scores, both based on the racial composition of the students in the classroom (e.g., a 2018 secondary analysis of the Measures of Effective Teaching (MET) dataset found teachers in classrooms with high concentrations of students of color receiving significantly lower observation ratings15), the race of the teacher (e.g., a 2018 working paper out of Vanderbilt University found that in Tennessee, Black teachers received significantly lower observation scores as compared to their white counterparts16), and the race of the observer (e.g., this same Vanderbilt working paper found that white supervisors tend to rate Black teachers more negatively than do Black supervisors.17)
Given these findings—and the research demonstrating the important role that observation can play in improving instructional practice18—districts would do well to consider the ways that they can mitigate potential bias within their observation processes.
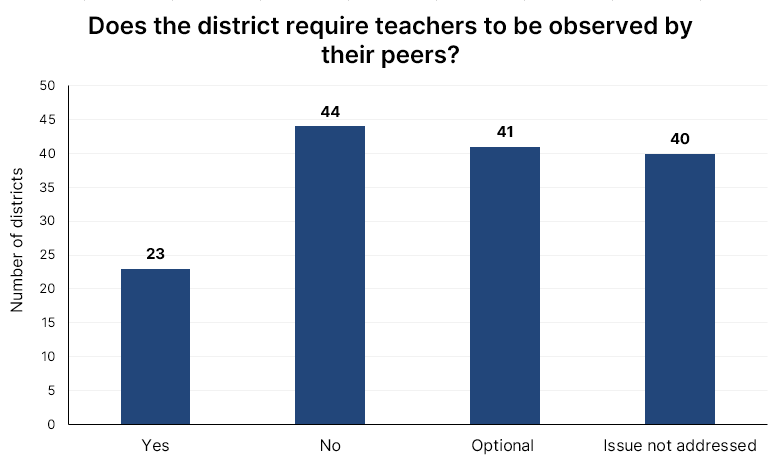
Notably, research suggests that multiple observations can increase reliability and mitigate observer bias,19 as can multiple observers.20 However, since teachers are most commonly observed by an administrator, including, but not limited to, their principal,21 each additional observation adds considerably to a principal’s workload. Districts have a few options for increasing the number of observations and increasing the observers, thereby reducing the burden on administrators while enabling teachers to be observed multiple times. One option districts can consider is to allow or require that teachers also be observed by their peers. Peer-led observation is a powerful strategy to increase the number of people who are trained and qualified to conduct observations, with research suggesting that peer observations produced similar marks as observations conducted by administrators.22 Teacher survey results highlight a strong preference for observations conducted by peers or mentors over other administrators,23 perhaps because observation feedback may be more specific to their subject.24 Despite these compelling reasons, fewer than half of the districts in this sample allow for peer-conducted observations25 (43%), with even fewer—only 23 districts—requiring it.
Figure 6.
A second option is to allow for an impartial third party from outside the school. Currently two districts require an external observer when a teacher was previously rated ineffective (Rochester School District (NY) and Buffalo School District (NY)), and another 40 districts provide it as an available option to teachers, often regardless of their previous observation score, such as in Albuquerque Public Schools (NM), where “[t]eachers may request that a second formal observation be performed by an alternate observer from the N.M. Public Education Department.”
Allowing for multiple observers brings several other benefits as well. First, multiple observers (as well as multiple observations) increases the reliability in ratings for teachers.26 Further, some research has identified potential bias in observation ratings, perhaps driven more by the demographics of students in the class than by the race or gender of the teacher.27 While this theory has not been proven, it’s likely that having multiple different well-trained observers can reduce the likelihood of bias in observations, especially if the district is strategic about building a diverse cohort of observers.
How do teachers receive feedback from their observations?
Constructive, detailed feedback and coaching is a critical component of teacher development. Research from the American Institutes for Research and the American Federation of Teachers found that teachers value and respond to high-quality feedback.28 For instance, one teacher survey found that teachers prefer frequent observations and detailed feedback (as opposed to few observations and general feedback), and that preference is more pronounced among younger generations: 75% for millennial teachers, 70% for Generation X teachers, and 59% for baby boomers.29
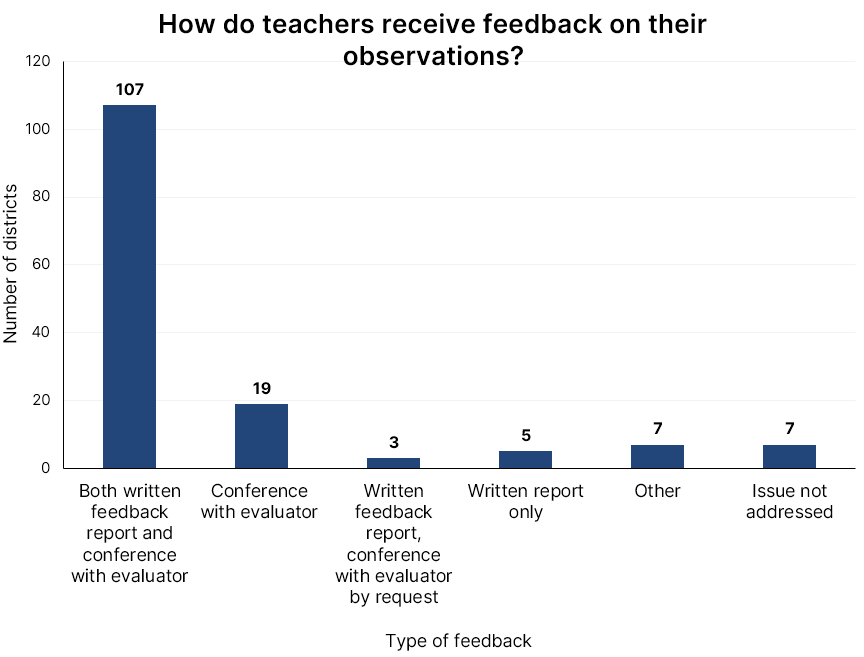
The vast majority of districts (107) in this sample require written feedback that is also accompanied by a conference. Written feedback—ideally accompanied by a conference between the observer and teacher—can help ensure the points of feedback are deliberate, well-articulated, and able to be referenced later as needed.30
Figure 7.
While it remains the case that the least effective and/or least experienced teachers should receive targeted, consistent support, all teachers, regardless of experience level, benefit from meaningful opportunities to improve. This is especially true given the additional stresses of the pandemic; however, many district-level feedback and observation policies have not yet caught up to best practice.
Conclusion
The past few years have required teachers to adapt quickly and meet new challenges. Receiving frequent, timely feedback can help them rise to meet these challenges, ensuring that they are as well-equipped as possible to provide an excellent education to their students.
While districts play a significant role in establishing guidelines to help promote conditions for teachers to improve their practice, state-level policy also sets important guardrails on systems of teacher evaluation more broadly. Our forthcoming State of the States 2022: Teacher and Principal Evaluation Policies explores trends in state policy, illustrating a stubborn gap between best practices and state policies to support high-quality evaluation in districts.

More like this

Establishing positive teacher-student relationships may help boost student outcomes

Effectively evaluating special education teachers may require a different approach

Seven ways to make improving teacher evaluation worth the work

The rise and fall of better teacher evaluation: Who gets the blame?
Endnotes
- Marsh, J. A., Bush-Mecenas, S., Strunk, K. O., Lincove, J. A., & Huguet, A. (2017). Evaluating teachers in the Big Easy: How organizational context shapes policy responses in New Orleans. Educational Evaluation and Policy Analysis, 39(4), 539-570; Stecher, B. M., Garet, M. S., Hamilton, L. S., Steiner, E. D., Robyn, A., Poirier, J., & de los Reyes, I. B. (2016). Improving teaching effectiveness: Implementation: The intensive partnerships for effective teaching through 2013–2014. RAND Corporation. Retrieved from:
https://www.rand.org/pubs/research_reports/RR1295.html; Strunk, K. O., Weinstein, T. L., & Makkonen, R. (2014). Sorting out the signal: Do multiple measures of teachers’ effectiveness provide consistent information to teachers and principals?. Education Policy Analysis Archives/Archivos Analíticos de Políticas Educativas, 22, 1-41. Retrieved from: http://www.redalyc.org/html/2750/275031898100; Taylor, E. S., & Tyler, J. H. (2012). The effect of evaluation on teacher performance. American Economic Review, 102(7), 3628-51. - Tuma, A. P., Hamilton, L. S., & Tsai, T. (2018). How Do Teachers Perceive Feedback and Evaluation Systems?: Findings from the American Teacher Panel. RAND Corporation. Retrieved from: https://www.rand.org/pubs/research_briefs/RB10023.html.
- The NCTQ sample of districts includes 148 school districts in the United States: the 100 largest districts in the country, the largest district in each state, and the member districts of the Council of Great City Schools.
- Gerber, N. (2019, October 10). Teacher evaluation that’s meaningful. National Council on Teacher Quality. https://www.nctq.org/blog/Teacher-evaluation-thats-meaningful.
- A complicating factor in analyzing patterns throughout this data set is that tenure policy differs at the state level. While this analysis pays particular attention to the similarities and differences between policies on the basis of tenure status, the point at which a teacher is granted tenure varies across the country. While most states set the minimum probationary period before earning tenure status at three years, four states have only a two-year probationary period, and the remaining 19 states have probationary periods of four years or more. Therefore, while the following analysis notes patterns in how policies differ by tenure status, it is helpful to keep in mind that teachers are at different points in their career when they move from being non-tenured to having tenure status.
- In instances where districts specified a range, an average value was calculated in order to compute the total average of observations per evaluation cycle.
- Granite School District (UT) is again unique in that tenured teachers are observed more frequently per 1 cycle as compared to their non-tenured teacher counterparts, though as previously established, the overall evaluation cycle is significantly less frequent for more experienced teachers.
- Garet, M.S., Wayne, A.J., Brown, S., Rickles, J., Song, M., & Manzeske, D. (2017). The Impact of Providing Performance Feedback to Teachers and Principals. National Center for Education Evaluation and Regional Assistance, Institute of Education Sciences, U.S. Department of Education. NCEE 2018-4.
- Note that Song et. al. (2021) found an improvement in teacher practice and student outcomes in mathematics but not in reading. Song, M., Wayne, A.J., Garet M.S., Brown, S., & Rickles, J. (2021). Impact of Providing Teachers and Principals with Performance Feedback on Their Practice and Student Achievement: Evidence from a Large-Scale Randomized Experiment; Journal of Research on Educational Effectiveness, 14:2, 353-378; Steinberg, M. P., & Sartain, L. (2015). Does better observation make better teachers: New evidence from a teacher evaluation pilot in Chicago. Education Next, 15(1), 71-77; Taylor, E. S., & Tyler, J. H. (2012). The effect of evaluation on teacher performance. American Economic Review, 102(7), 3628-51.
- Tuma, A. P., Hamilton, L. S., & Tsai, T. (2018). How Do Teachers Perceive Feedback and Evaluation Systems?: Findings from the American Teacher Panel. RAND Corporation. Retrieved from: https://www.rand.org/pubs/research_briefs/RB10023.html.
- Districts often distinguish between the type of observations as either unannounced and announced. However, NCTQ’s Teacher Contract Database does not collect this data.
- Cantrell, S. & Kane, T.J. (2013). Ensuring Fair and Reliable Measures of Effective Teaching: Culminating Findings from the MET Project’s Three-Year Study. Seattle, WA: Bill & Melinda Gates Foundation, Policy and Practice Brief, Measures of Effective Teaching project.
- Prado Tuma, A., Hamilton, L. S., & Berglund, B. (2018). How Do Teachers Perceive Feedback and Evaluation Systems? Findings from the American Teacher Panel. Santa Monica, CA: RAND Corporation. https://www.rand.org/pubs/research_briefs/RB10023.html.
- Cantrell, S. & Kane, T.J. (2013). Ensuring Fair and Reliable Measures of Effective Teaching: Culminating Findings from the MET Project’s Three-Year Study. Seattle, WA: Bill & Melinda Gates Foundation, Policy and Practice Brief, Measures of Effective Teaching project; Hill, H. C., Charalambous, C. Y., & Kraft, M. A. (2012). When Rater Reliability Is Not Enough: Teacher Observation Systems and a Case for the Generalizability Study. Educational Researcher, 41(2), 56-64.
- Campbell, S. L., & Ronfeldt, M. (2018). Observational evaluation of teachers: Measuring more than we bargained for?. American Educational Research Journal, 55(6), 1233-1267.
- Grissom, J., Bartanen, B., & Jones, A. A. (2019). Retaining Teachers of Color in an Era of High-Stakes Teacher Evaluation: Investigating Racial Differences in Teacher Evaluation Ratings and Teacher Turnover. Vanderbilt University. Retreived from https://cdn.vanderbilt.edu/vu-my/wp-content/uploads/sites/2824/2019/04/14200330/retentionoftoc_grissom_bartanen_jones.pdf.
- Grissom, J., Bartanen, B., & Jones, A. A. (2019).
- Allen, J. P., Pianta, R.C., Gregory, A., Mikami, A.Y., & Lun, J. (2011). An interaction-based approach to enhancing secondary school instruction and student achievement. Science, 333(6045), 1034-1037; Dee, T.S. & Wyckoff, J. (2015), Incentives, Selection, and Teacher Performance: Evidence from IMPACT. Journal of Policy Analysis and Management, 34: 267-297; Papay, J.P., Taylor, E., Tyler, J., & Laski, M. (2020). Learning job skills from colleagues at work: Evidence from a field experiment using teacher performance data. American Economic Journal: Economic Policy, 12(1):359-388.
- Cantrell, S. & Kane, T.J. (2013). Ensuring Fair and Reliable Measures of Effective Teaching: Culminating Findings from the MET Project’s Three-Year Study. Seattle, WA: Bill & Melinda Gates Foundation, Policy and Practice Brief, Measures of Effective Teaching project.; Whitehurst, G.J., Chingos, M.M., & Lindquist, K.M. (2015). Getting Classroom Observations Right: Lessons on How from Four Pioneering Districts. Education Next, 15(1), 62-68.
- Hill, H. C., Charalambous, C. Y., & Kraft, M. A. (2012). When Rater Reliability Is Not Enough: Teacher Observation Systems and a Case for the Generalizability Study. Educational Researcher, 41(2), 56–64.
- Brandt, C., Mathers, C., Oliva, M., Brown-Sims, M., & Hess, J. (2007). Examining district guidance to schools on teacher evaluation policies in the Midwest Region (Issues & Answers Report, REL 2007–No. 030). Washington, DC: U.S. Department of Education, Institute of Education Sciences, National Center for Education Evaluation and Regional Assistance, Regional Educational Laboratory Midwest. Retrieved February 25, 2008, from Brandt, C., Mathers, C., Oliva, M., Brown-Sims, M., & Hess, J. (2007). Examining district guidance to schools on teacher evaluation policies in the Midwest Region (Issues & Answers Report, REL 2007–No. 030). Washington, DC: U.S. Department of Education, Institute of Education Sciences, National Center for Education Evaluation and Regional Assistance, Regional Educational Laboratory Midwest. Retrieved February 25, 2008, from http://ies.ed.gov/ncee/edlabs/regions/midwest/pdf/REL_2007030.pdf
- Cantrell, S. & Kane, T.J. (2013). Ensuring Fair and Reliable Measures of Effective Teaching: Culminating Findings from the MET Project’s Three-Year Study. Seattle, WA: Bill & Melinda Gates Foundation, Policy and Practice Brief, Measures of Effective Teaching project.
- Tuma, A. P., Hamilton, L. S., & Tsai, T. (2018). How Do Teachers Perceive Feedback and Evaluation Systems?: Findings from the American Teacher Panel. RAND Corporation. Retrieved from: https://www.rand.org/pubs/research_briefs/RB10023.html.
- Kraft, M. A., Blazar, D., & Hogan, D. (2018). The effect of teacher coaching on instruction and achievement: A meta-analysis of the causal evidence. Review of Educational Research, 88(4), 547-588.
- This analysis considers a peer-conducted observation to be any classroom observation conducted by another teacher, irrespective of grade, subject, or additional leadership role (e.g., department chair).
- Cantrell, S. & Kane, T.J. (2013). Ensuring Fair and Reliable Measures of Effective Teaching: Culminating Findings from the MET Project’s Three-Year Study. Seattle, WA: Bill & Melinda Gates Foundation, Policy and Practice Brief, Measures of Effective Teaching project.
- Campbell, S.L., & Ronfeldt, M. (2018). Observational Evaluation of Teachers: Measuring More Than We Bargained for? American Educational Research Journal, 55(6), 1233–1267.
- Coggshall, J.G., Behrstock-Sherratt, E., & Drill, K. (2011). Workplaces That Support High-Performing Teaching and Learning Insights From Generation Y Teachers. A Report From the American Federation of Teachers and American Institutes for Research.
- Survey data from Coggshall, J. G., & Ott, A. (2009). Retaining teacher talent: Convergence and contradictions in teachers’ perceptions of policy reform ideas. Naperville, IL: Learning Point Associates & Public Agenda, based on a reanalysis of the “Retaining Teacher Talent” survey, cited in Coggshall, J.G., Behrstock-Sherratt, E., Drill, K. (2011). Workplaces That Support High-Performing Teaching and Learning Insights From Generation Y Teachers. A Report From the American Federation of Teachers and American Institutes for Research.
- Wayne, A. J., et al. (2016). Early implementation findings from a study of teacher and principal performance measurement and feedback: Year 1 Report (NCEE 2017-4004). Washington, DC: National Center for Education Evaluation and Regional Assistance, Institute of Education Sciences, U.S. Department of Education. Duchaine, E. L., Jolivette, K., & Fredrick, L. D. (2011). The effect of teacher coaching with performance feedback on behavior-specific praise in inclusion classrooms. Education and Treatment of Children, 34(2), 209-227.