Math skills are critical for students’ success in other subjects and later in life, yet far too many teacher prep programs fail to give aspiring teachers the essential knowledge they need to be effective math teachers—undermining student learning before the first lesson even begins.
What can California, Texas, and Washington, D.C. teach us about how to diversify the teacher workforce?
Nationally, the diversification of the teacher workforce is slowing compared to the diversification of college-educated adults, but California, Texas, and Washington, D.C. are bucking that trend. Explore what factors contribute to their relatively high rates of teacher diversity and how their policies and practices will likely affect teacher quality.
Districts are facing hard choices: How can teacher evaluation help?
Teacher evaluation systems—if implemented well—can help districts make better workforce decisions. We examine whether large districts’ policies align with the research on what will likely make for effective and impactful evaluation systems.
Even though I’m well launched into my professional career, I still keep in touch with my old high school English teacher. From my freshman year onward, she drove me to participate more in class and had a lasting impact on my life trajectory. I know she taught me much more than the difference between metaphors and similes—and now there’s research out there to prove it.
Benjamin Master (RAND), Susanna Loeb (Stanford University), and James Wyckoff (University of Virginia) investigated teachers’ long-term impact on student achievement across subject areas. Using achievement data on middle schoolers in New York City and Miami-Dade County, they asked two key questions:
Does having either a great English or math teacher one year influence how much a student will learn in the following years?
Does having a great teacher in one subject improve students’ scores in another subject?
The answers: yes and yes.
Calculating teachers’ value-added scores after their students had moved on to the next grade, they found that the contributions teachers made to student achievement in the subject they taught persisted not only through the following year but for the following two years (and perhaps even longer, as that was as far as they looked).
The researchers also calculated teachers’ impact on their students’ achievement in another subject that they did not teach. Again, even after two years, English teachers’ contribution to students’ math achievement persisted, with an impact ranging from about a quarter to nearly half as much as their impact on students’ English scores (comparing findings for the two districts).
However, the reverse didn’t hold for math teachers, and it’s not hard to understand why. Students learn broad skills in English class that translate across disciplines, such as the ability to read a math problem. In our scramble to address the shortage of STEM teachers as well as our nation’s lackluster achievement in math and science, we would do well to remember the power of a top-notch English teacher.
Undergraduate programs struggle to prepare high school teachers
The National Council on Teacher Quality’s (NCTQ) evaluation of 717 undergraduate programs preparing high school teachers found that many programs do well preparing teachers in some subjects but fall short with science and social studies, and almost all continue to struggle providing high quality practice opportunities.
One key component of teacher compensation is health insurance. It gets less attention than salaries and pensions, but as the costs of health care rise, this issue will become increasingly visible. This month, District Trendline uses data from the Teacher Contract Database to examine how much of the health insurance premium is covered by school districts and how this has changed over the last four years.
Unpacking Secondary Certification: State Certification Discontinuity
There are nearly as many arrangements of science and social studies certifications as there are states, which is somewhat astonishing considering almost all high school students take the same core courses (biology, history, government, etc.) regardless of where they live.
While I have many memories from my first year of teaching, one of the most visceral comes from my early morning commute. I had to take several buses across the Bronx to reach my school, always aiming to arrive well before my students. In the dead of winter, after too few hours of sleep, I’d wait for one bus while watching the one I’d just exited turn around – heading back toward my apartment. Some mornings, I needed all my willpower not to chase it down and go back to bed. But instead, I always continued my journey to school, and to the piles of work and (mostly) eager 7th graders awaiting me.
A new study shows that like me, other first-year teachers are quite good at consistently showing up to school rather than staying home. Ben Ost (University of Illinois at Chicago) and Jeffrey Schiman (Georgia Southern University) look at how the number of teachers’ absences (counting only sick and personal days, not professional development) change as their workload (e.g., class size, years of experience) changes.
While first-year teachers take few days off, teachers’ absences edge up for the next few years of teaching (at least based on the data from North Carolina). This trend toward more absences among more experienced teachers is notable because past research has found that teacher absences hurt student outcomes. In fact, this paper estimates that the gains in student learning attributed to having a more experienced teacher would be about 10 percent higher if those veteran teachers took fewer days off. This finding reaffirms that every day a teacher spends in the classroom is a critically important one.
While improving teacher attendance is no simple task, the North Carolina study sheds light on one potentially influential factor: school culture. Researchers found that when a teacher transferred from one school to another, her rate of absence crept toward the average for that school – for better or worse. (And yes, the authors took several steps to ensure that they weren’t simply capturing a “school-level shock” like a flu that hits everyone at the school.) Given that NCTQ’s past work on this issue, the 2014 Roll Call study, didn’t find any district policies that were silver bullets for improving teacher attendance, it seems that school-level factors may be a promising place on which to focus.
First let’s get the obvious points out of the way. I get that your constituents love small class sizes. Certainly, no rational teacher will tell you that large classes are easier to teach than small classes. And, unlike many education fixes, the benefits of smaller class sizes do not require lengthy explanations making the eyes glaze over. Everyone immediately understands—and applauds!
For these reasons, I’m not surprised that the North Carolina legislature has gotten itself into a real pickle over class size reductions, now having to figure out what to do with a well-intentioned but unworkable new law. That law, passed in the last session, requires school districts to lower K-3 class sizes from the current limit of 24 students to as few as 19.
With the law set to go into effect next fall, districts have announced that in order to comply with the new law that they will have to concurrently lay off art, music, and PE teachers—who, in addition to being wildly important to parents and kids, are the reason classroom teachers get a much needed break during the day to refuel and plan. Catch 22. Suddenly this very popular move isn’t looking so popular anymore.
It’s not my intention to single out the NC legislature here. There is no shortage of states that have gone down this road and lived to regret it, most dramatically California in 1996 and Florida in 2003. Those states were dumbfounded over the unintended—but entirely foreseeable—problems of their own creation as a result of top-down mandates. It started with the lack of empty classrooms available to accommodate new teachers, but more importantly, they learned that there is not a bottomless supply of teachers, especially good ones.
In other words, it turns out that students are better off in a crowded classroom that is led by a strong teacher than in a small class taught by a weak teacher.
Here’s an example in the extreme. My daughter lives on a farm in rural South Africa. She volunteers teaching English at the local public school, encountering class sizes that make a mockery of our class size debates. Classes in this remote Zulu school range from 75 to 100 students, with four children sitting in desks intended for two. Her first impression of this situation was immediate sympathy for the school’s well-meaning English teacher and what an impossible job she has.
But as she has spent more time in this classroom, she is more struck by how poorly, indeed incompetently, the teacher and her principal have chosen to deal with this tough situation—such as ignoring a closet full of new computers that could help them break the classroom into more manageable groups and failing to assess the students on their proficiency so that they might be re-organized, if only to teach each other—to name but two basic strategies that could be relatively easily put in place, but which have not been. It is no wonder that most of these 13-year-olds, who must learn English if they ever want a real job, have yet to learn to string together a sentence of English.
Don’t get me wrong. There’s still no question that the class size here is a huge obstacle. But the bigger problem in this poor, rural school resides in the poor quality and training of the both the teacher and the principal who oversees her work. Neither is in a position to change the hand they’ve been dealt, but additional training and some ingenuity on the part of these adults could produce far better outcomes.
Every classroom has its challenges that must be overcome. While in the US, even the weakest teachers are likely to know to pull out the computers and find a way to group the kids, more complex and immediate instructional challenges are harder to anticipate, and certainly impossible to solve from on-high. And given my druthers—and I’d wager every parent’s—I’d rather that the person in front of the room can think fast on her feet and pivot on a dime, which is what well trained, skilled teachers know how to do.
When legislatures opine about smaller class sizes, I can’t help but think that the evidence isn’t getting a fair hearing, particularly the poor return on investment from a long history of states’ class size reduction initiatives. Says economist Rick Hanushek, “Perhaps the most astounding part of the current debates on class size reduction is the almost complete disregard for the history of such policies.”
I do know that the positive results from the Tennessee STAR class size reduction experiment routinely get trotted out in these debates, with one important fact routinely omitted. None of the STAR champions point out that it was a carefully constructed experiment involving only 11,000 students attending schools that had voluntarily signed-up to participate. The schools had the opportunity to decide it made sense for them to participate.
Buy-in, local context, and comprehensive planning all critically matter. Apparently, those are lessons that are best learned state by state, legislator by legislator, which is too bad for kids.
If you’re even a casual observer of the trends in higher education, odds are you’re familiar with the persistent challenge of grade inflation. The rise of college grades—in the absence of any evidence that today’s college student has become harder working than the students of the past—has led to questions about the role instructors likely play. Are today’s college instructors holding their students accountable and taking the time to provide accurate feedback?
The question is particularly germane for teacher candidates, who must enter classrooms ready to teach on Day 1. And yet, our 2014 report, Easy A’s and What’s Behind Them, revealed teacher preparation programs to be particularly egregious offenders when it comes to grade inflation. In our sample of over 500 institutions, we found that grading standards were much lower for teacher candidates than for students pursuing other majors at a majority (58 percent) of those institutions.
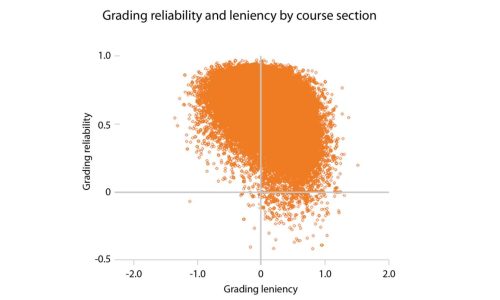
Given the scale of this problem in teacher prep, we were particularly interested in a new study that provides fresh insight on the roots of grade inflation for all college students. Ido Millet, a professor at Penn State Behrend, assembled a massive dataset that included the grades awarded across more than 50,000 course sections and the GPAs of students enrolled in them. His analysis relied on two measures. The first, “leniency,” is the difference between the average grade for a course and the average GPA of the students enrolled in that course. The second measure, “reliability,” is a measure of how closely course grades align with students’ overall GPAs.
The figure below shows the 50,000+ course sections graphed according to their leniency and reliability. In the upper left corner, we see that there are a lot of tough courses (those that score low on leniency) for which the grading is fairly reliable. In comparison, there are relatively few tough courses for which the grading is unreliable (notice that the bottom left corner of the graph is fairly empty).
Source: Ido Millet (2016)
So, why might a tough course have more reliable grading? Millet ventures a guess that it may be a matter of the quality of assignments given to the students in the class. Being an “easy grader” doesn’t cause a professor to be unreliable; if that were the case, the graph above wouldn’t show so many courses for which the grading was both lenient and reliable (upper right corner). What’s more likely is that unreliable assessment tools lead an instructor to be lenient. In other words, if course assignments do not permit the instructor to make an accurate judgment about the quality of the work, then it becomes more likely that an instructor will inflate grades rather than risk giving a good student a low grade unfairly.
While Millet didn’t have access to course assignments for his study, NCTQ’s own review of assignments given in teacher prep courses would suggest that his hypothesis is spot on. In Easy A’s, we analyzed assignments across multiple majors (nursing, business, and psychology, in addition to teacher prep) for a subset of seven institutions. By a substantial margin, assignments given in teacher prep courses were more likely to require an instructor to base grading on a subjective judgment.
Consider the assignments that we commonly find in teacher preparation programs: Reflect on your experience learning how to read. Write a philosophy of math instruction. Conduct a field observation. These assignments all require course instructors to trust the reality their students describe. And for each, the line between a right answer and a wrong answer—between someone prepared to become a teacher and someone who is missing the mark—is obscure at best. How could an instructor possibly grade such assignments reliably? More importantly, how will graduates respond when they begin a career that is much less forgiving than the college classroom?
Unpacking Secondary Certification: The Two Types of Certification
There is a seemingly simple path to high school certification: complete a major in the subject you want to teach while taking a few courses like classroom management and methods of instruction along the way.
In recent years, teacher evaluation policy has been front and center in the quest to improve teacher quality. This month, we take a look at the basic building blocks of any evaluation system: how many ratings exist and what components make up a teacher’s evaluation.
How can we evaluate the effectiveness of pay-for-performance compensation systems if those systems are implemented only half-heartedly? That continues to be the prevailing question, as we review yet another expensive study reporting on the outcomes from another highly flawed performance pay experiment.
A recent Mathematica Policy Research study examines the experience of 66 schools housed in 10 districts that received Teacher Incentive Fund (TIF) grant money beginning in 2010. Through the grant, teachers were eligible for bonuses intended to be substantial, differentiated based on role or setting, and challenging to earn. Teachers working in the control group received a 1 percent raise each year.
So what happened? The TIF schools reported a small bump in student achievement, equaling roughly four additional weeks of learning over the three-year study period. Based on teacher surveys, researchers found little evidence of the negative outcomes that many worry could arise from a competitive pay system, such as increased dissatisfaction with the school environment or evaluation processes.
Still, this experiment continues what’s now become a tradition of really poor implementation. Almost all of the teachers qualified for bonuses (70 percent), the schools shorted teachers in the terms of the size of the bonuses (probably because they were handing out too many), and the districts oversaw an apparently inadequate communications plan that left nearly half of the teachers working in the schools unaware that there were any bonuses to be earned.
The small bump in student achievement … how do we explain that? It’s possible that we would have seen greater improvement with better program implementation. It’s also possible that performance pay initiatives of this type have effects that mitigate the potential for any meaningful gains in student achievement. The flaws in this study run too deep for us to know the answer.
In our ongoing tally of performance pay experiments, we’re putting this one in the dud column.
Looking for an effective math teacher? What about a skilled science instructor? Need both? UTeach programs have you covered.
That’s the takeaway from a remarkably positive study of seven UTeach programs that prepare some of the most effective math and science teachers in Texas. Ben Backes and his colleagues at CALDER found that, compared to other high school teachers in the state, graduates from the original UTeach program at the University of Texas at Austin produce as much as four months of additional learning in math and nearly six months of additional learning in science. For high school algebra and biology, the difference in student outcomes for UTeach and non-UTeach teachers is larger than the difference in outcomes between new teachers and what we typically see after a teacher has ten years of experience!
Established 20 years ago by UT Austin and now in place at 45 institutions in 21 states and the District of Columbia, UTeach not only produces more effective teachers but also produces a lot of them. STEM teacher production has grown substantially at many of the institutions, in some cases even doubling output since implementation of UTeach. By 2020, UTeach programs will have produced over 8,000 math and science teachers.
What’s the secret? Unlike most traditional teacher prep programs (which recruit for those who wish to teach), UTeach programs seek to interest in teaching those headed to math and science majors. As early as their first year, program participants complete two field-based courses, and if they opt to continue, all professional coursework is STEM-specific. Teacher candidates can complete the UTeach program in four years, graduating with their math or science degrees along with certification.
While the study’s authors concede the difficulty of conclusively ascribing outcomes to the UTeach model—as opposed to other institution-level effects—the central finding is clear: school leaders who hire UTeach grads are making a pretty good bet.
Positive Reinforcement for Great Districts for Great Teachers
Over the course of NCTQ’s first decade, I’ll admit to having struggled a bit to figure out how to influence the policies and practices of school districts. There are 14,000 school districts, and only one of us.
For a substantial amount of time, we studied specific districts’ teacher quality practices, hoping to generate change, one district at a time. The approach we took was to make sure whatever we learned in our studies was made available to local community actors, helping them to become change agents on our behalf. So each time we finished one of these studies, we’d deliver our findings at community meetings with lots of local press in attendance. With a few notable exceptions, the superintendent and even the union heads would show up, anxiously biting their bottom lips as NCTQ inevitably revealed data most districts would prefer not be held up for public consumption.
Though many of these studies generated important reforms, I’m no longer convinced that this was the right way to go. More recently, I’m struck by the enormous challenges school districts face, particularly big districts teaching a lot of kids who live in poverty. Districts rarely make the news for positive reasons. (Even when there is positive news, there always seems to be at least one reporter who, deciding that the district must be playing fast and loose with the numbers, acts like a dog with a bone.)
Enough with the self-criticism. It’s time to discuss our fresh approach.
Last week we announced the first eight school districts in the country earning our Great Districts for Great Teachers honors. It’s our way of elevating those school districts that have established the policies, programs, and most importantly the culture of recognizing, valuing, rewarding, and supporting their best teachers.
The first-ever Great District winners are (in alphabetical order):
Two of our district finalists proved themselves standouts even among this elite group by surpassing our standards. So we created a special category for these Outstanding Great Districts for Great Teachers. They are:
No one, not us nor the districts nor the teachers in them, is saying that these districts are doing everything right by their teachers. But they deserve recognition for being more successful than most. We hope this initiative motivates other districts to covet this designation for themselves, leading them to adopt similar practices and policies supporting their own great teachers. These exemplary “Great Districts” show what is possible and how supporting great teachers can transform a district into a Great District.
So will this strategy prove effective long-term? I’m hopeful. As any teacher would tell you, praise and positive reinforcement can go a long way to promote positive behavior.
You can learn more about the Great Districts for Great Teachers initiative and our criteria at www.greatdistricts.org.
Reading drives nearly everything in schools — from learning about other cultures by reading textbooks, to finding out about the planets by reading about astronomy, to discovering about great heroes of the past by reading history.
Defying Expectations: The Right Teacher Can Help Low-Income Students Go Above and Beyond
What makes the difference in how well low-income students perform on Advanced Placement (AP) exams?
A recent study published in Urban Education investigated over a dozen characteristics of students, teachers, and schools to identify common trends among students who beat expectations on AP Biology and AP Chemistry exams. The study, which included nearly 12,000 students in high-poverty schools, focused on students who earned higher AP scores than predicted based on their Preliminary SAT Qualifying Test (PSAT) results.
Student characteristics (in particular, whether a student speaks English as a second language) had the greatest impact on AP scores. Certain school and teacher characteristics also pushed the needle—but not always in the right direction. Teacher quality, teacher professional development, and school screening practices each add pieces to the puzzle.
Teacher knowledge and experience: A quality teacher can make the difference
Unsurprisingly, teacher knowledge and experience had a substantial, significant impact on student performance. When a teacher had more years of experience teaching a subject (especially teaching that specific AP course), stronger participation in professional associations and conferences related to their subject, or experience serving as an AP reader or consultant, the difference showed up in student scores. One of the best ways that schools can help their students earn higher AP scores is ensuring those classes are taught by teachers who really know their stuff.
Professional development: An inconsistent factor
For the best AP teachers, current professional development offerings just aren’t cutting it. Teachers whose students beat expectations on the AP tests reported the lowest satisfaction with their PD activities. All teachers need the opportunity to continue their professional growth, and this study provides a prime example of how great teachers can feel left out of development opportunities that may not be differentiated for top-performers.
Student screening: High scores with a high cost
Of the schools in the study sample, 55 percent limited enrollment in AP classes using a screening process, which might be based on previous achievement or teacher recommendations. This selectivity created the single greatest AP score gain over expectations of any school or teacher variables. However, we know that student screening, particularly when it involves subjective judgments, tends to leave out students of color who could benefit from and succeed in challenging academic settings. Screening might produce a higher pass rate on AP tests, but if the end goal is to create a culture of high expectations for all students, more inclusive enrollment practices may win the day.
Other factors, such as greater per-student funding and a longer school year also led to better student performance, but the effects were fairly small. Students cannot change where they come from, the income-level of their parents, or their native language, but their schools (and teachers!) can provide them with opportunities to perform well on AP exams and beyond.
Running in Place highlights the paradox of the ineffective “effective” teacher—one who fails to impact student achievement but remains eligible to receive a good performance evaluation. This prospect represents a major weakness in evaluation frameworks, and we’d love to see this particular loophole closed. But, no conversation about teacher evaluation is complete without a reminder about the importance of using multiple measures to assess teacher performance. A new study about student surveys gives us the perfect opportunity to keep up that drumbeat.
Researchers Tanner Wallace (University of Pittsburgh), Benjamin Kelcey (University of Cincinnati), and Erik Ruzek (University of Virginia) used data from the Measures of Effective Teaching (MET) Project to see how well student perceptions of teacher quality aligned with other performance measures, including observations and value added. The survey instrument—Tripod—covers seven dimensions of teacher quality, including the student’s perception that a teacher cares about students, solicits their viewpoint, teaches engaging material, clarifies ideas, places content in context, sets high expectations, and exhibits good classroom management.
They found that students’ overall perception of their teachers (measured as a composite of all dimensions, except classroom management) correlated, albeit modestly, with teacher’s value-added scores. The classroom management dimension, by itself, also correlated with teachers’ value-added scores and the classroom management component of teacher observations. In other words, the study provides fresh evidence that student surveys provide credible, supplementary insight into teacher performance.
The results are good news for the rapidly growing number of states that rely on student surveys in teacher evaluations. In 2013, 14 states encouraged or required the use of student surveys in teacher evaluations; by 2015, that number had grown to 33. Together, surveys, student achievement measures, and observation scores can provide a more complete picture of a teacher’s performance—presuming states and districts treat each component with the seriousness it deserves.
But no, it was a headline from the Utah Deseret News. Its irony wasn’t lost on us but we wager most of the subscribers were left scratching their heads, not realizing that teachers don’t have to demonstrate that they are effective teachers in order to keep their jobs. Even in states that have passed landmark laws within the last five years requiring that teachers’ evaluations incorporate measures of student growth, virtually all teachers still continue to be rated effective.
The status quo on teacher evaluations has barely budged.
Given that Donald Trump’s daily decisions tend to mop up all the press attention, it would have been easy to miss a new report from NCTQ, Running in Place: How New Teacher Evaluations Fail to Live Up to Promises. This report describes a rather remarkable yet unreported phenomenon in which 28 of the 30 states that now require teacher evaluations to incorporate significant evidence of student learning don’t really do what these laws set out to accomplish. These new laws’ regulations and guidelines, most of them probably written with substantive contributions from “stakeholder groups” interested in preserving the existing system, undercut the laws’ intent.
In fact, in 16 states teachers who receive the lowest possible score on their ability to increase student learning, can still mathematically qualify for a rating of effective or higher. Another bunch of states chose not to weigh in but left it up to their districts to decide, with the results that there too we see little change in the status quo.
Running in Place highlights the danger of relying solely on legislative action to advance education reforms. It reveals how state education organizations need to become more centered around supporting positive change, even if it means disrupting cozy relationships with opponents of change. While we certainly should celebrate when a state legislature enacts reform-oriented laws, faithful implementation is crucial to the law’s success in the real world.
Frankly, I fear the ship of teacher evaluation has not only sailed, but also sunk. Legislatures, hyper sensitive about shifts in political winds, will be more likely in 2017 to backpedal even further, given recent pushback on holding teachers accountable for student learning. After all, if teacher evaluation laws don’t change the status quo, why bother expending political capital on them?
However, not all hope is lost. We know that states can take powerful action because two states have done so successfully. Indiana and Kentucky have clear policies that require teachers to meet specific goals on student learning in order to be rated effective. And New Mexico is implementing a system that sorts teachers into meaningfully different categories in spite of what the laws technically allows.
States should prevent teachers from earning an effective rating if they are ineffective at increasing student learning. Teacher evaluation must evolve from an exercise of compliance to a process that identifies an individual teacher’s strengths and weaknesses in an effort to support continual development. ESSA provides states with a prime opportunity to carefully consider the role of student growth in their teacher evaluation systems.
A vital lesson from this study is how difficult it is to make real change in the education system that benefits students. Even if one level agrees to an improvement, other levels can thwart it. As exhausting as the legislative process may be, the regulatory process is just as important if not more important.
By working at all levels we can take stories about states ignoring student achievement in teacher ratings and relegate them to the realm of satire where they belong.
A workaround for counterproductive pension systems
No school district wants to lose their most effective teachers. But pension systems, which are under the purview of state legislatures, are one roadblock to retention. These pension systems often incentivize teachers to make early retirements – and districts are powerless to change that.
Dongwoo Kim and his colleagues at the University of Missouri experiment with a novel retention tool aimed at teachers nearing retirement age.
They developed two models – one addressing STEM teachers in Missouri and the other addressing teachers found to be highly effective in another unnamed state. Each model estimates the effects of giving these teachers bonuses at particular ages, beginning with teachers in their mid-50s, around the time when they might begin to retire to maximize their pension benefits.
Not all that surprisingly, the bonuses did the trick, with larger bonuses having bigger effects. Furthermore, the effects compounded over time, meaning that experienced teachers would come to factor the expectation of bonuses into their retirement decisions and stay longer.
How expensive is this approach? They found that the net cost to get a STEM teacher to stay an additional year in Missouri schools is $32,000 (including the cost of the bonus, plus the additional cost of the experienced teacher’s salary compared to an inexperienced new hire). That’s not cheap, but for districts with specific shortages, the cost may be worth it.
Ed Reformer: Does self interest make us Debbie downers?
For over 50 years, Americans have worried about our students’ mediocre performance on international tests. A single-minded focus on rankings–not only in the media, but also bouncing around the echo chamber of the education reform community–meant that the nation has missed a recent and significant opportunity to celebrate some success.
I worry that the ed reformers, us included, are often guilty of highlighting bad news to stress the need for reform. But our habit of only seeing the black cloud and never the silver lining is just plain demoralizing. That’s why I want to highlight some good news.
Last month the Organization for Economic Cooperation and Development (OECD) released the results of its 2015 Program for International Student Assessment (PISA). While the news media expressed disappointment at our overall performance—down in math and flat in science and reading—they pretty much ignored this chart.
It turns out that the US is showing some surprising success at significantly narrowing socioeconomic achievement gaps in science. The percentage of students in the bottom quarter of socioeconomic status but the top quarter of academic performance – went up 12.3 percentage points in science since 2006, an increase eight times the OECD average. High achievers now comprise 31.5 percent of the bottom quarter in the U.S. (above the OECD average). The OECD reported that the “United States shows the largest improvements in equity during this period.”
I ran this data by Education Trust, as well as some esteemed scholars including Eric Hanushek, none of whom surfaced any obvious reason to dismiss the results.
Said U.S. Education Secretary John King Jr., “Data show that the relationship between poverty and student achievement has declined in recent years, at least in science, with students’ socioeconomic status becoming a less reliable predictor of performance… Socioeconomic status accounted for 11 percent of the variation in student performance in 2015 – down 6 percentage points from 2006. And the U.S. has made more progress in closing the socioeconomic achievement gap than any other PISA country.”
People, this is good news plain and simple. Even though our low SES students continue to score lower than their wealthier peers, the science score gap is below the OECD average. The average science score of our lowest-achieving students went up 18 score points.
Some reformers dismiss these findings for reasons I can’t appreciate—and which I suspect reside in our penchant for the negative. It’s easier to call for changes by harping on the bad news. And yet, by constantly emphasizing the negative, we play into the hands of those who would completely dismantle public education. If all the public hears is bad news about our education system, and the constant reforms never seem to result in good news about improvement, eventually they will give up on reform and public education both and agree to some form of privatization.
Those of us in the education community need to present an accurate picture of what is happening in our schools, the good as well as the bad. At NCTQ we are striving to take a more positive tone, balancing positive and negative findings as appropriate and if we can do it, anyone can. For instance, our December Landscape report on undergraduate teacher prep programs educating elementary teachers emphasized the progress since our last Teacher Prep Review – especially in reading. And later this year we will announce the winners of our Great Districts for Great Teachers competition, recognizing the districts that most successfully support great teaching.