Math skills are critical for students’ success in other subjects and later in life, yet far too many teacher prep programs fail to give aspiring teachers the essential knowledge they need to be effective math teachers—undermining student learning before the first lesson even begins.
What can California, Texas, and Washington, D.C. teach us about how to diversify the teacher workforce?
Nationally, the diversification of the teacher workforce is slowing compared to the diversification of college-educated adults, but California, Texas, and Washington, D.C. are bucking that trend. Explore what factors contribute to their relatively high rates of teacher diversity and how their policies and practices will likely affect teacher quality.
Districts are facing hard choices: How can teacher evaluation help?
Teacher evaluation systems—if implemented well—can help districts make better workforce decisions. We examine whether large districts’ policies align with the research on what will likely make for effective and impactful evaluation systems.
No one is surprised when 9th and 10th grade students want to be rock stars, professional athletes, or YouTube celebrities. But when some of them want to be teachers, it’s worth taking a moment to unpack what’s motivating those students—and figure out how to leverage that motivation to inspire others—especially when it comes to attracting the most talented students into the profession.
When it comes to attracting out-of-state teachers, do states shoot themselves in the foot?
As many states struggle to staff all their classrooms, they might want to examine the degree to which their own policies discourage qualified teachers from applying.
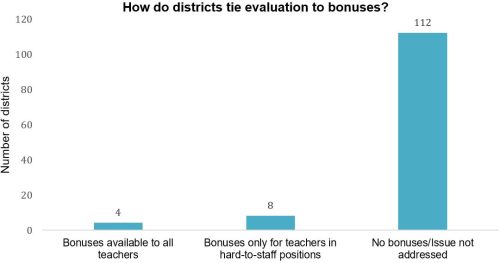
Performance Pay: How Teacher Evaluations Impact Compensation
In light of new research regarding performance pay, this month’s Trendline takes a look at how a teacher’s evaluation rating affects salary in some of the largest districts in each state and across the country.
Want to keep great teachers in high-needs schools? Train them there
Even today, high-needs schools struggle to attract and, more critically, retain effective and experienced teachers. We think teacher prep programs are missing a huge opportunity to tackle this issue, through student teaching placements.
A new study suggests that offering performance bonuses to a smaller segment of high performing teachers than is typical in schools using performance pay may be a smart move.
There is a cautionary lesson from a new working paper examining Houston’s bold talent initiative. In many ways, it yielded the results intended by retaining a higher number of great teachers and exiting weak ones. It also led to a few unintended and unwelcome outcomes.
Local
context matters. It’s true when it comes to teacher
shortages, and it shouldn’t come as a surprise that it would be true when
it comes to teacher retention, too.
November 2017: Teacher Planning and Collaboration Time
While salary often dominates news headlines about teacher contract negotiations, time to plan is often just as precious to teachers. Let’s take a look at how much time 124 large districts set aside for teachers to plan lessons, grade, collaborate, and engage in other non-teaching activities that are necessary in order to provide good instruction.
A bright spot for PD—new teacher induction that works
Districts spend on average $18,000 per teacher every year on professional development, with little to show for it. That’s why we were excited to see the new research findings looking at the New Teacher Center’s induction model–most teachers’ first experience with professional development. A recent study found that the New Teacher Center’s approach resulted in up to five months of additional learning. Remarkable!
But there’s a real puzzle here to be solved. While student outcomes–what matters most–showed tremendous gains, teachers’ observation ratings did not. Other than there not being enough observations conducted to detect differences, one explanation may be the instrument used to observe the teachers, that being the tried and true Danielson Framework. It may be time to revisit those indicators to ensure that they align with student outcomes at the earliest stages of a teacher’s career.
Here are the attributes of the NTC approach that yielded dramatic learning gains:
First off, significant time is dedicated to building districts’ capacity to support the induction model. Mentors are carefully selected and intensively trained to assess their teachers, and instructed to meet with each mentee for at least 180 minutes a month and focus on instruction during that time.
Most striking was the program’s significant investment in mentor training–with a requirement of 100 hours of training for each mentor teacher for two years. Could that be the secret sauce?
The big question left isn’t if districts should use this model, but if they can afford it. The cost to implement the program is just $500-$900 per new teacher for the New Teacher Center’s services, but that doesn’t include the districts’ costs for the mentor teachers and any associated stipends or salaries. These line items could run a district $5,600-$8,000 for a fully-released mentor per teacher, depending on the local salary scale (credit to NTC for providing us with these estimates). Our bottom line is that if these outcomes are consistently replicated, the costs are without question fully defensible.
Dallas pay for performance initiative producing positive results
NCTQ has long supported teacher pay for performance in school districts. Better pay can encourage the best teachers to stay in the classroom and prompt talented people to enter the profession knowing they will be rewarded for their achievements.
In 2015, Dallas became the largest school district to adopt performance pay instead of a traditional salary schedule. Results out this month reveal that three years into this program, the district has achieved impressive gains.
The district is reporting improvement in teacher retention, keeping 86 percent of its teachers compared to 83 percent statewide, but most critically, with the most effective teachers having the highest retention rates. Meanwhile, half of those at the lowest effectiveness rating left–also key.
In addition, the district has been able to reduce the number of schools with a low rating from the state from 43 down to 14 campuses. And Dallas’ graduation rate has grown significantly, from 83 percent to 88 percent between 2012 and 2017.
While it is unlikely that all these achievements can be attributed to teacher pay reforms, we see signs of smoke, even though we cannot yet say there is fire.
Ever play the carnival game of whack-a-mole? Every time you smash one mole back into its hole, two more pop back up. That’s how NCTQ’s analysts feel right now with states’ plans to close educator equity gaps under the ESSA. However, what’s at stake here is not a cheap stuffed animal prize, but the access that some of our most vulnerable students have to strong teachers.
Among the 34 state plans we reviewed this fall, too many permit continued discrimination against low-income students and students of color by failing to ensure that these students have equitable access to effective, experienced, and in-field teachers; that is, to those teachers who are most likely to contribute to these students’ academic learning and growth.
This past spring, we analyzed states’ plans to meet ESSA’s educator equity requirements for the first 17 state plans submitted to the United States Department of Education for peer review and approval. We discovered these plans to be a real mixed bag, displaying strengths but also significant opportunities for improvement. Our spring analyses spotlighted specific components of state work worth replicating, but also noted numerous areas where states missed the mark.
Unfortunately, the plans of the remaining 34 states address few of the common flaws noted in our prior review. Instead of emulating the promising practices among the first 17 state plans and adapting suggestions for improvement, as appropriate based on local context and need, we found that an even greater percentage of the ESSA state plans that we analyzed this fall fell short.
Although plans alone are insufficient to change students’ daily in-school experience, language matters. A state’s ESSA plan sets forth its understanding of the current status of education within its state and the steps it intends to take to address any shortcomings that are preventing all students from reaching their maximum potential.
Yet, among the 50 states and the District of Columbia, fewer than half of states define “inexperienced teacher” based on research demonstrating that teacher effectiveness increases substantially after two years in the classroom. And only seven states include sufficiently detailed and rigorous timelines and interim targets for eliminating their identified educator equity gaps. Such measures are important to help ensure that states and stakeholders are able to hold themselves accountable for monitoring, assessing, and — ultimately — eliminating any existing educator equity gaps.
Despite these flaws, we are pleased to acknowledge and celebrate states from our fall review with plans that contain some strong elements. For example, many state plans include promising strategies to eliminate existing educator equity gaps, including Florida’s ESSA state plan which leverages a state law that prevents any Florida student from being taught by an ineffective teacher for two years in a row.
Other states, including South Carolina and Ohio, are calculating and reporting educator equity gaps using, among other data, student-level data, which enable these states to determine whether there are any educator equity gaps existing within a specific school.
Additionally, Kentucky and New York go above the beyond the statutory requirements to calculate and report educator equity gaps for additional student groups: students with disabilities and English learners. Calculating and reporting the extent to which these vulnerable student populations are taught by ineffective, out-of-field, or inexperienced teachers enables these states to take steps to address additional educator inequities that may exist within the state, beyond those required by the statute.
Nevertheless, overall, we are forced to conclude states have largely shirked their responsibility to prevent low-income students and students of color from being disproportionately taught by ineffective, out-of-field, or inexperienced teachers.
Fortunately, there is still time for states to improve their plans. We hope that states will carefully review and consider our analyses, which highlight specific opportunities for each state to strengthen its plan. More can and must be done to ensure that all students have equitable access to effective, experienced, and in-field teachers.
This second part of our book recommendations focuses on books that help teachers learn about how to teach students to read and books on the big picture–international comparisons and efforts to improve education generally.
Border walls between states and their impact on kids
Despite how some organizations tend to discuss teacher supply, the United States doesn’t have just one teacher labor market, but at least 50. Why is the labor market so fragmented? Each state creates its own teacher licensure policies and none of them employ a practical approach to licensure reciprocity. The result is a complex and expensive process for teachers who want to teach in another state. Couple this obstacle with inflexible pension systems and, voila, each state has its own labor market.
In that vein, a group of economists at the University of Missouri set out to learn how these ‘walls’ between states impact student achievement. To investigate, Dongwoo Kim, Cory Koedel, Shawn Ni, and Michael Podgursky devised a clever study comparing student achievement at schools that are within a few miles of a state border to schools that are not near state borders.
Why would that be telling? We know from previous research that teachers like to work close to where they live, so if various state policies make it difficult for teachers to move across state lines, those schools close to state lines would in theory have a smaller pool of teachers from which to recruit. This, in turn, might decrease teacher quality in those schools.
The results of this study prove the hypothesis correct. Using a 10-mile radius as each school’s prime hiring market, the researchers determined that in schools where at least 25 percent of the potential teacher workforce lived across state lines, 8th grade math achievement was lower compared to that in schools that had access to all of the potential teacher workforce within 10 miles.
The authors note that although the effect is relatively small, there are over 600 schools that reside near state borders, thereby impacting the achievement levels of 670,000 students across the country.
One can imagine that in places like Dakota Valley School District, bordered by districts in Nebraska and Iowa, easier licensure reciprocity could be a big boon to teacher recruitment efforts.
One step states can take to ensure that students near the border don’t miss out on the best teachers is to offer a standard teaching license to certified teachers from out of state–taking some of the border walls down.
Permit me to draw my inspiration from scripture, referencing the basic human needs of clothes on our backs, food to eat, and a shelter over our heads. How better to discern if in fact teacher salaries are where they need to be? Applying salary data from our Teacher Contract Database, we asked this question: are teachers paid enough to put a roof over their heads?
How principals can change the culture around teacher evaluations
Imagine a test where the only grades a student could earn were A or A-. Envision an update to Yelp that allows customers to rate restaurants using only 4 or 5 stars. Picture a panel of judges at an ice-skating competition where the only scorecards say 9 or 10.
That’s what’s going on with teacher evaluations, despite a long and brutish effort to get states and districts to do otherwise. Most teachers continue to receive high ratings and there’s very little evidence that anyone is below average.
October 2017: Does low pay shut teachers out of the housing market?
Teacher salaries are always in the news, but in the last few months we’ve noticed that housing affordability for teachers is in the spotlight, with many school districts exploring ways to support teachers’ ability to rent or purchase homes. This month, we assess the ability of teachers to: 1) rent an apartment, 2) save for a down payment, and 3) make a monthly house payment.
Every minute counts. So teachers need to know which books are best worth their limited time. It’s with this in mind that we offer these book lists–which represent some of the best thinking on motivating students, instructional techniques, and classroom management strategies.
Too often in education, education groups’ pursuit of validation for their policy priorities and the media’s desire for a strong narrative lead them to whip up a public frenzy at the expense of accuracy and nuance. That’s certainly what happened with states’ rapid retreat from testing as well as their sudden distaste for the Common Core standards. It’s why state legislatures continue to fight for class size reductions even though the adjustments are always too marginal to have any real impact on learning.
It’s also true when it comes to declarations of a national teacher shortage, claims that the media has bought hook, line, and sinker. Reporters continue to cite a 2016 report from the Learning Policy Institute (LPI) with the title, “A Coming Crisis in Teaching?” Its stark conclusion warned that the nation may face a 100,000+ plus annual teacher shortage by 2018. You may recall this troubling graphic:
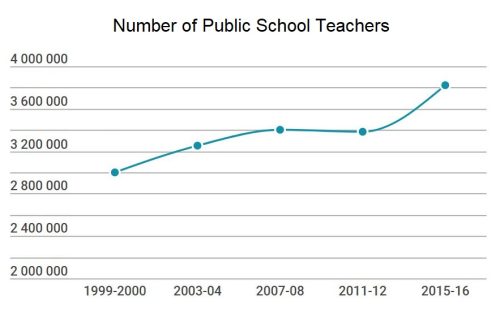
It’s almost 2018, folks and while LPI’s dire predictions rested on one set of assumptions, we now have actual data that showed that their projections were way off. The newest data out of NCES show that our public school teacher workforce is not shrinking but growing! In 2015-16, the estimated number of teachers reached over 3.8 million – an increase of about 400,000 in four years.
Moreover, based on 2015-16 projections, the number of students probably hasn’t grown nearly as fast as the number of teachers. Education Week reports, “The number of students went up about 2 percent over four years. And the number of teachers went up 13 percent during that same time.”
Check out this great graph from Education Week illustrating this change in population. It clearly shows a dip after the Great Recession, but since then, contrary to the fears of those claiming a nationwide teachers shortage, the teacher workforce has grown at a much faster rate than the student population.
You can see our own depiction of growing teacher workforce below, using NCES’s data:
Of course, none of this is meant to deny the existence of severe shortages in some places or in some teaching areas. What it DOES mean is that, overall, there is not a new national teacher shortage. See our recent shortage fact sheet for more information.
We still don’t know why this increase has occurred. Possible explanations include that more people may be completing teacher preparation programs, that current teachers may be staying longer, that the student population may be growing, or that states are hiring more teachers through emergency certifications.
Unfortunately, one of the dangers of trying to solve the chronic misalignment of teacher supply and demand by erroneously labeling it a national teacher shortage is that the resulting remedies are all wrong. Of course, states and districts need to address their very real struggles recruiting teachers in some fields and localities. Still, in order to develop rational and effective solutions, leaders need a clear and accurate picture of the problem – and not a flawed, worst-case scenario.
For instance, districts may reject the idea of paying higher salaries to all teachers as unaffordable. But, they may be able to afford paying higher salaries specifically to teachers in shortage fields and location.
Similarly, states may react to the shortage mirage by authorizing poorly qualified emergency certified teachers, rather than improving reciprocity to make it easier for teachers to move into the state.
Teacher preparation programs, working on the assumption that a national shortage means plentiful job opportunities, may wind up preparing teachers for overpopulated fields like elementary education instead of recommending would-be teachers also obtain certification in special education or ESL.
So, the bottom line is, the teacher workforce has grown in the last few years. Now these researchers and analysts have a responsibility to acknowledge that their fears have not come true. Those who allow the media to perpetuate inaccurate stories are doing a disservice to school districts and their students across the country.
1. Data Sources: U.S. Department of Education, National Center for Education Statistics, Schools and Staffing Survey (SASS), “Table 209.20: Number, highest degree, and years of full-time teaching experience of teachers in public and private elementary and secondary schools, by selected teacher characteristics: Selected years, 1999-2000 through 2011-12.” Retrieved 25 August 2017 from: https://nces.ed.gov/programs/digest/d15/tables/dt15_209.20.asp. Taie, S., and Goldring, R. (2017). Characteristics of Public Elementary and Secondary School Teachers in the United States: Results From the 2015–16 National Teacher and Principal Survey First Look (NCES 2017-072). U.S. Department of Education. Washington, DC: National Center for Education Statistics. Retrieved 25 August 2017 from https://nces.ed.gov/pubsearch/pubsinfo.asp?pubid=2017072.
Halloween might be over a month away, but new teachers have their own terror to face as school begins: “Classroom” and “management” are two of the scariest words for anyone about to start teaching for the first time.


 1. Data Sources: U.S. Department of Education, National Center for Education Statistics, Schools and Staffing Survey (SASS), “Table 209.20: Number, highest degree, and years of full-time teaching experience of teachers in public and private elementary and secondary schools, by selected teacher characteristics: Selected years, 1999-2000 through 2011-12.” Retrieved 25 August 2017 from: