Alex Ferro is a graduate student studying Educational Policy at Boston University. He currently serves as an Analyst in Boston Public Schools' Office of Data and Accountability.
The pursuit of student well-being and success takes a village. Though educator staffing research often focuses on teachers, schools also employ a growing number of paraprofessionals,1049 counselors, and people in other support roles. School-based staff in support roles make key contributions in the school ecosystem, providing essential services and filling in gaps to boost student outcomes, improve the quality of teachers' lives at school,1050 and promote students' development1051 through mentorship.
Our analysis of national staffing data finds that over the last 10 years, the proportion of individuals in these support roles has consistently grown. However, at least in one state, paraprofessional positions also experience the highest rate of vacancies among school staff.1053 With a looming Elementary and Secondary School Emergency Relief (ESSER) funding cliff and subsequent budgetary constraints, district leaders will have to consider whether their current staffing levels will allow them to preserve and support non-teaching staff, just as they will have to consider teacher staffing levels. This District Trendline uses the U.S. Department of Education's Common Core of Data (CCD) to compare changes in school staffing across different support and teaching roles over the past decade. Education leaders can use this analysis to see how staffing has changed in their state and how it compares to other states nationwide.
To calculate staffing ratios, we divided the number of teachers (or other educators) in the state by the number of thousands of K–12 students in public schools in each state. Districts with access to their staff and student counts can easily replicate this calculation to see how their district compares to other districts in their state and other states.
Note that in this analysis, the term educators includes teachers, paraprofessionals, and guidance counselors.
The number of educators, including teachers, school counselors, and paraprofessionals, saw a steady nationwide increase as compared to the number of students over the last 10 years. Compared to a national teacher increase of 2.6 teachers per 1,000 students (an increase of about 4%), growth rates of paraprofessionals and school counselors outpaced teachers with an increase of 3.6 paraprofessionals and 0.5 school counselors per 1,000 students, an increase of approximately 25% for both groups. All groups experienced the steepest growth over the latter five years (2018–22), perhaps due to the influx of pandemic recovery funding.
This overall increase does mask some variation among states. Figure 2 gives insight into this variation by looking at percent changes in teacher-to-student ratios across the entire 10-year period. Thirteen states saw a decrease in their teacher-to-student ratios from 2012 to 2022, although only three states saw a decrease of greater than 10% (Alabama, Florida, and Louisiana). Among the 37 states with increases in teachers per 1,000 students, these increases range from less than 1% (Iowa) to nearly 25% (Oregon). Nationally, the average number of teachers per 1,000 students in 2022 climbed to 65.1, an increase of over 3% since 2012.
Changes in educator-student ratios are driven by a decrease in student enrollment as well as an increase in staffing numbers across all roles. Nationally, student enrollment decreased by approximately 5,000 students per state on average over the 10-year period. Enrollment levels rose consistently until a sharp decline in 2020 and have since been recovering. Average educator staffing numbers across states increased by more than 6,300 total educators over the 10-year period with fewer teachers in 2020 and 2022, a small dip in paraprofessionals in 2020, and counselors remaining unchanged between 2012 and 2022.
Evidence has shown that educator-support roles, such as paraprofessionals and school counselors, may help reduce teacher turnover1057 and improve student outcomes.1058 Support educators contribute to students' feelings of connectedness at school,1059 leading to positive academic and lifelong outcomes.
Paraprofessional-to-student ratios have increased across 45 states over 10 years, with only three states seeing a paraprofessional-to-student ratio decrease of greater than 3% (New Hampshire, North Carolina, and Vermont). Notably, however, both New Hampshire and Vermont have consistently led the country in their paraprofessional-to-student ratios, rising above other states by 15 to 20 paraprofessionals per 1,000 students consistently.
Figure 4 demonstrates that percentage changes in paraprofessional-student ratios over the past 10 years range from an 11% decrease in North Carolina (approximately two fewer paraprofessionals per 1,000 students) to a 91% increase in New York (15 paraprofessionals per 1,000 students). Despite our best efforts, we were unable to identify any policy actions or events in New York that explained such a drastic increase in the paraprofessional role across the state by 2019. New York's near doubling of its paraprofessional-student ratio occurred alongside an 11.5% increase in its teacher-student ratio (an increase of nearly seven teachers per 1,000 students) in the same time period. North Carolina's decrease in its paraprofessional-to-student ratio coincides with a decrease in its teacher-student ratio within the 10-year span.
Though there may not be a consensus target for paraprofessional-student ratio, studies have "found significant positive effects of a higher ratio of teaching assistants to students on students' reading and mathematics achievement, with especially strong effects in low-income districts serving more students of color."1060
School counselor-student ratios increased in 47 states, while only four saw a decrease (Louisiana, New Mexico, Tennessee, and Wyoming) over the 10-year span (see Figure 4). Every state that experienced a significantly decreased counselor ratio (dropping by more than 5%) also experienced teacher ratio decreases, which is antithetical to the overall national growth trends of teacher ratios. These percentage changes in school counselor-student ratios range from a 27% decrease in Wyoming to increases upwards of 75% in California and Oregon.
Although we've seen a slow and consistent increase in counselor-student ratios, the 2022 national average sits below the American School Counselor Association's recommendation of four counselors per 1,000 students,1061 a ratio that only New Hampshire and Vermont exceed.
One state, Oregon, stands out for notable growth across all categories of educators. Oregon sat near or below the national average for all groups of educators in 2012. Over 10 years, they saw exceptional growth in the number of support educators, increasing their school counselor ratio by 1.25 counselors per 1,000 students as well as their paraprofessional ratio by 6.19 paras per 1,000 students. In addition to their immense growth in support-educator ratios, Oregon boasted the largest teacher-student ratio change in the country with a near 25% increase over 10 years (and some Oregon districts are now facing layoffs).
The pursuit of student well-being and success takes a village. Though educator staffing research often focuses on teachers, schools also employ a growing number of paraprofessionals,1049 counselors, and people in other support roles. School-based staff in support roles make key contributions in the school ecosystem, providing essential services and filling in gaps to boost student outcomes, improve the quality of teachers' lives at school,1050 and promote students' development1051 through mentorship.
Our analysis of national staffing data finds that over the last 10 years, the proportion of individuals in these support roles has consistently grown. However, at least in one state, paraprofessional positions also experience the highest rate of vacancies among school staff.1053 With a looming Elementary and Secondary School Emergency Relief (ESSER) funding cliff and subsequent budgetary constraints, district leaders will have to consider whether their current staffing levels will allow them to preserve and support non-teaching staff, just as they will have to consider teacher staffing levels. This District Trendline uses the U.S. Department of Education's Common Core of Data (CCD) to compare changes in school staffing across different support and teaching roles over the past decade. Education leaders can use this analysis to see how staffing has changed in their state and how it compares to other states nationwide.
Methodology in brief
CCD data provides state-specific statistics on staffing levels including teachers, paraprofessionals, and school counselors. We analyzed and compared the last 10 reported years (2012 to 2022) of educator-per-student staffing trend data across each state and role. We calculated ratios of teachers, school counselors, and paraprofessionals per 1,000 students, as well as the percent change over this 10-year period. The data visualizations below explore national trends as well as educator-per-student ratios across various roles. This dataset does not include other crucial school staff such as social workers, coaches, or nurses, as this data was unavailable to disaggregate in a meaningful way.To calculate staffing ratios, we divided the number of teachers (or other educators) in the state by the number of thousands of K–12 students in public schools in each state. Districts with access to their staff and student counts can easily replicate this calculation to see how their district compares to other districts in their state and other states.
Overall educator and teacher staffing rates have increased
Teachers wear many different hats in the classroom. The services that educator-support roles provide can help teachers care for and educate their students, reducing teachers' feelings of overwhelm and burnout. Districts often used federal ESSER funds to hire additional educators1052 so they can prioritize student well-being, academic needs, and mental health. As those funds dry up, the impending "fiscal cliff" may pressure some school districts to weigh the value of educator roles as they right-size their district budgets. While not all states track how districts used ESSER funds, data from states that do track these expenditures suggests that about half of district ESSER funds paid for labor expenses (e.g., salaries for new hires and pay raises and stipends for current staff). And indeed, many districts have used their ESSER funds to hire more staff.1054Note that in this analysis, the term educators includes teachers, paraprofessionals, and guidance counselors.
The number of educators, including teachers, school counselors, and paraprofessionals, saw a steady nationwide increase as compared to the number of students over the last 10 years. Compared to a national teacher increase of 2.6 teachers per 1,000 students (an increase of about 4%), growth rates of paraprofessionals and school counselors outpaced teachers with an increase of 3.6 paraprofessionals and 0.5 school counselors per 1,000 students, an increase of approximately 25% for both groups. All groups experienced the steepest growth over the latter five years (2018–22), perhaps due to the influx of pandemic recovery funding.
Figure 1.
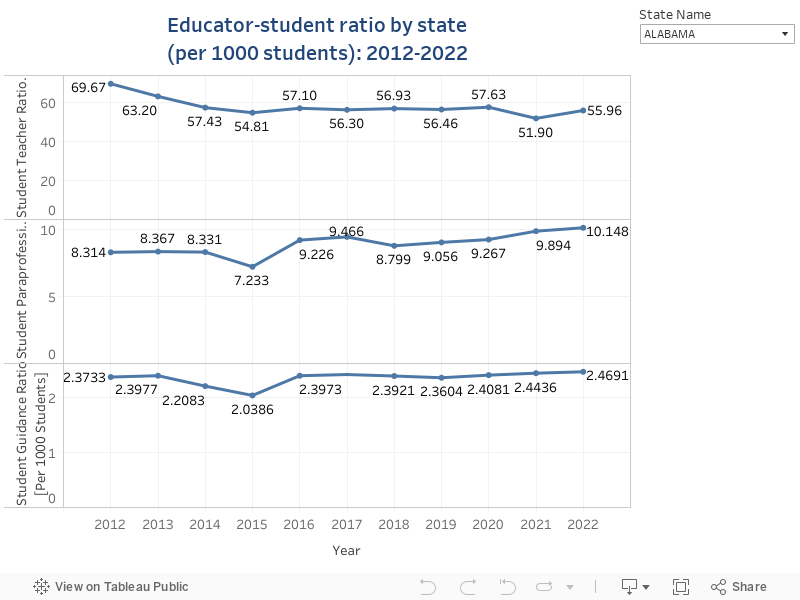
The educator-student ratio is found by dividing the total number of educators in a role by the total number of students. To interpret the results practically, we then multiplied the ratio number by 1,000 to see how many educators per group of 1,000 students there are across each role in each state (which can be selected from the drop-down menu) and nationally. This graph illustrates staffing trends by looking at the annual number of teachers, paraprofessionals, and counselors per group of 1,000 students between 2012 and 2022.
The educator-student ratio is found by dividing the total number of educators in a role by the total number of students. To interpret the results practically, we then multiplied the ratio number by 1,000 to see how many educators per group of 1,000 students there are across each role in each state (which can be selected from the drop-down menu) and nationally. This graph illustrates staffing trends by looking at the annual number of teachers, paraprofessionals, and counselors per group of 1,000 students between 2012 and 2022.
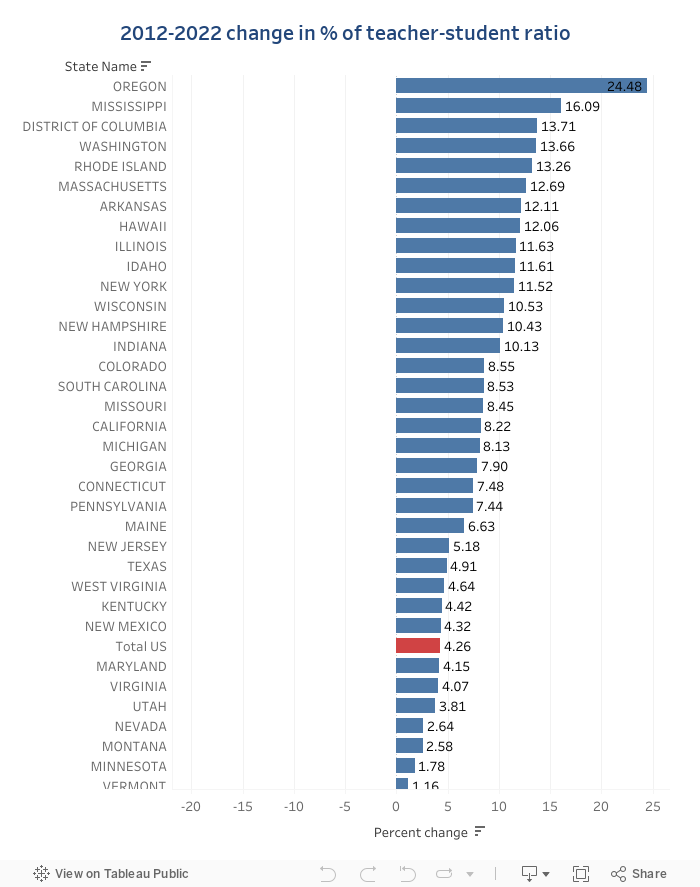
This overall increase does mask some variation among states. Figure 2 gives insight into this variation by looking at percent changes in teacher-to-student ratios across the entire 10-year period. Thirteen states saw a decrease in their teacher-to-student ratios from 2012 to 2022, although only three states saw a decrease of greater than 10% (Alabama, Florida, and Louisiana). Among the 37 states with increases in teachers per 1,000 students, these increases range from less than 1% (Iowa) to nearly 25% (Oregon). Nationally, the average number of teachers per 1,000 students in 2022 climbed to 65.1, an increase of over 3% since 2012.
Figure 2.
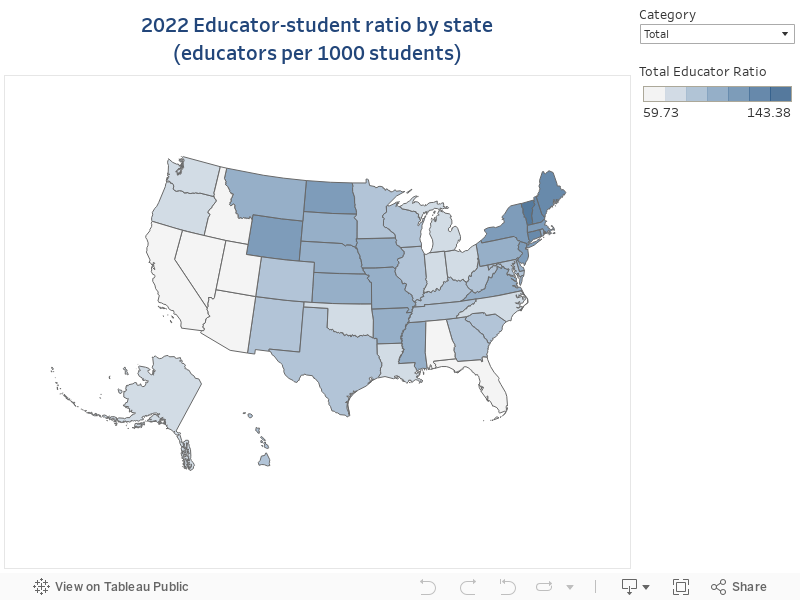
These trends show high variability in educator ratios among roles and states (see Figure 3), reinforcing that staffing is a local endeavor. In our most recent data, the national average sits close to 86 educators per 1,000 students with the highest ratios concentrated in the Northeastern United States. Above-average staffing levels extend from the mid-Atlantic coast through the Midwest as far as Montana. Teachers are the largest population of educators per student by a wide margin (compared to school counselors and paraprofessionals), and so have the greatest influence on states' overall educator ratios. Changes in educator-student ratios are driven by a decrease in student enrollment as well as an increase in staffing numbers across all roles. Nationally, student enrollment decreased by approximately 5,000 students per state on average over the 10-year period. Enrollment levels rose consistently until a sharp decline in 2020 and have since been recovering. Average educator staffing numbers across states increased by more than 6,300 total educators over the 10-year period with fewer teachers in 2020 and 2022, a small dip in paraprofessionals in 2020, and counselors remaining unchanged between 2012 and 2022.
Figure 3.
Educator-support staffing trends: paraprofessionals and school counselors
Though the focus of educator shortage rhetoric is often on teachers, several sources indicate that paraprofessional positions have high vacancy rates. The new and nationally representative school pulse panel survey1055 indicated that classroom aides/paraprofessionals were the most frequently cited position with vacancies. This monthly survey acts as a primary source of information on a range of high-priority topics that concern policymakers and other education stakeholders, and the findings are reflective of the barriers to hiring a sufficient number of qualified educators. A working paper by CALDER1053 analyzing job postings to evaluate the severity of vacancies in Washington State similarly finds that paraprofessionals have the highest number of job postings and that the severity of vacancies is much higher in schools with the highest percentages of students of color. Paraprofessionals are leaving the profession at higher rates,1056 and district leaders must plan for the need to fill paraprofessional vacancies and maintain these staffing levels.Evidence has shown that educator-support roles, such as paraprofessionals and school counselors, may help reduce teacher turnover1057 and improve student outcomes.1058 Support educators contribute to students' feelings of connectedness at school,1059 leading to positive academic and lifelong outcomes.
Figure 4.

Paraprofessional-to-student ratios have increased across 45 states over 10 years, with only three states seeing a paraprofessional-to-student ratio decrease of greater than 3% (New Hampshire, North Carolina, and Vermont). Notably, however, both New Hampshire and Vermont have consistently led the country in their paraprofessional-to-student ratios, rising above other states by 15 to 20 paraprofessionals per 1,000 students consistently.
Figure 4 demonstrates that percentage changes in paraprofessional-student ratios over the past 10 years range from an 11% decrease in North Carolina (approximately two fewer paraprofessionals per 1,000 students) to a 91% increase in New York (15 paraprofessionals per 1,000 students). Despite our best efforts, we were unable to identify any policy actions or events in New York that explained such a drastic increase in the paraprofessional role across the state by 2019. New York's near doubling of its paraprofessional-student ratio occurred alongside an 11.5% increase in its teacher-student ratio (an increase of nearly seven teachers per 1,000 students) in the same time period. North Carolina's decrease in its paraprofessional-to-student ratio coincides with a decrease in its teacher-student ratio within the 10-year span.
Though there may not be a consensus target for paraprofessional-student ratio, studies have "found significant positive effects of a higher ratio of teaching assistants to students on students' reading and mathematics achievement, with especially strong effects in low-income districts serving more students of color."1060
School counselor-student ratios increased in 47 states, while only four saw a decrease (Louisiana, New Mexico, Tennessee, and Wyoming) over the 10-year span (see Figure 4). Every state that experienced a significantly decreased counselor ratio (dropping by more than 5%) also experienced teacher ratio decreases, which is antithetical to the overall national growth trends of teacher ratios. These percentage changes in school counselor-student ratios range from a 27% decrease in Wyoming to increases upwards of 75% in California and Oregon.
Although we've seen a slow and consistent increase in counselor-student ratios, the 2022 national average sits below the American School Counselor Association's recommendation of four counselors per 1,000 students,1061 a ratio that only New Hampshire and Vermont exceed.
One state, Oregon, stands out for notable growth across all categories of educators. Oregon sat near or below the national average for all groups of educators in 2012. Over 10 years, they saw exceptional growth in the number of support educators, increasing their school counselor ratio by 1.25 counselors per 1,000 students as well as their paraprofessional ratio by 6.19 paras per 1,000 students. In addition to their immense growth in support-educator ratios, Oregon boasted the largest teacher-student ratio change in the country with a near 25% increase over 10 years (and some Oregon districts are now facing layoffs).
Educator-support roles are paramount to school success
While this data provides insight into state and national progress to staff schools with more educators in support roles, the work is far from over.- Policymakers would benefit from more robust and detailed data on support roles within schools (including data specific to nurses, mental health support professionals, social workers, and coaches) at state and district levels.
- Districts should leverage their own local data to identify internal staffing ratios across roles to see where they can bolster their internal support roles. They may want to pay particular attention to educator-support staff in schools serving more students of color and students living in poverty, since these roles directly benefit students and can help retain teachers.
- Districts that anticipate financial constraints would be wise to limit reductions in support educators (such as paraprofessionals and counselors), or make reductions over time rather than make significant cuts in one year. These positions play key roles in supporting student success and teacher working conditions.
- Districts may also want to find creative ways to fill these positions in a sustainable manner. For example, they could leverage student teachers to serve as paraprofessionals part-time or create supportive paraprofessional-to-teacher pathways.